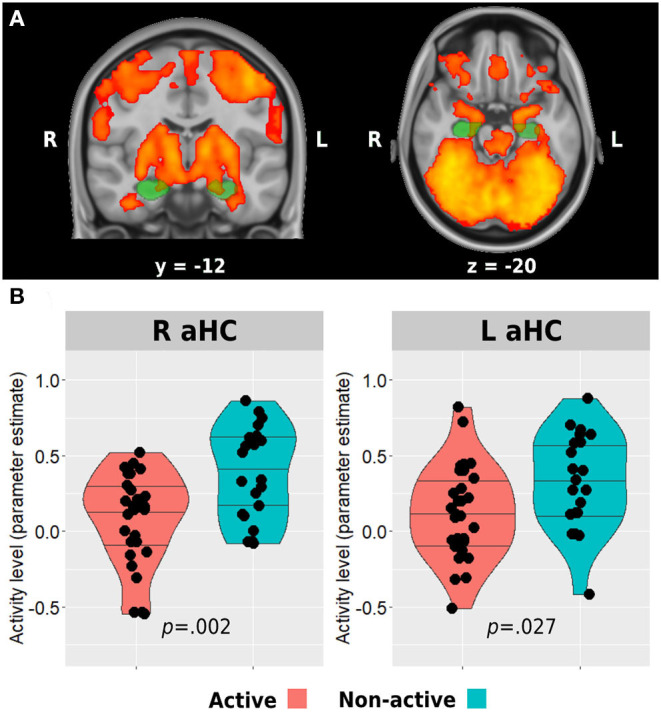
Figure 2.

Anterior hippocampus activation during memory encoding. The whole sample mean activation during the task is presented in (A). Green regions represent anatomical masks of anterior hippocampi, while activated voxels within these areas were used to extract the activity level for the between-group analysis presented in (B). Horizontal lines in between-group plots represent 25, 50, and 75% quantiles. aHC, anterior hippocampus; L, left; R, right.
