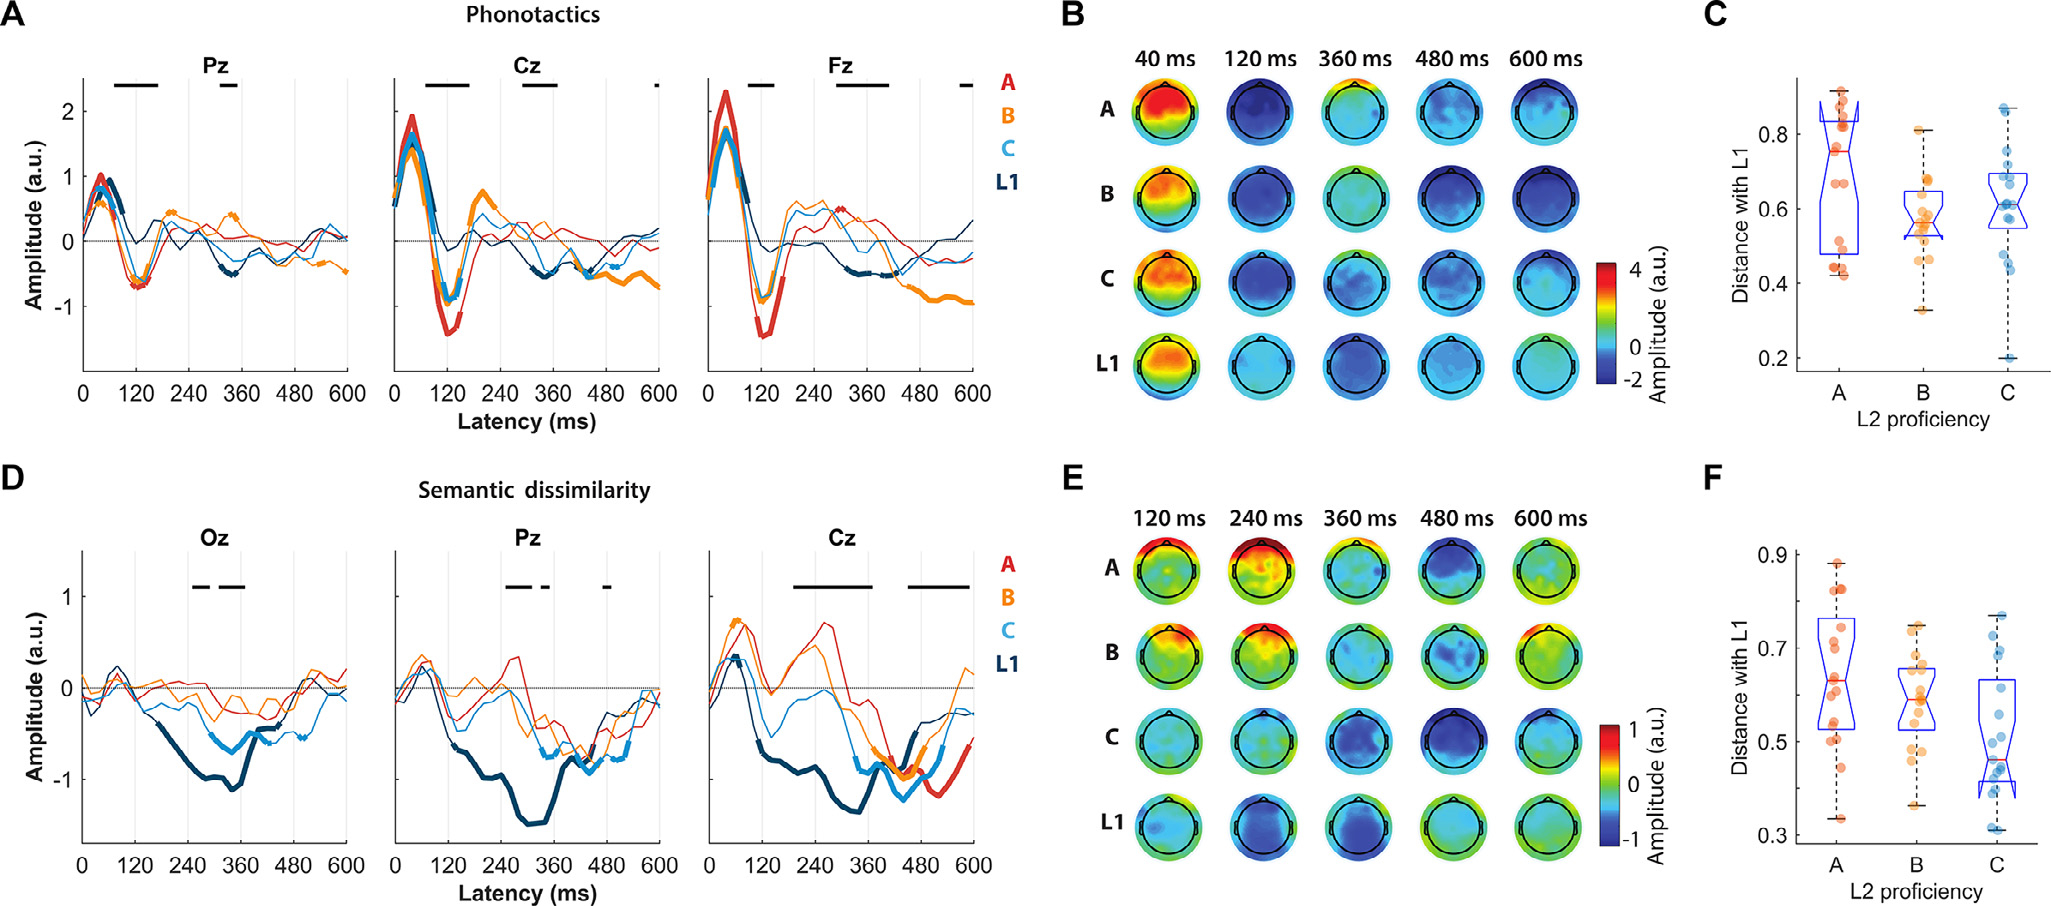
Fig. 3.

Effect of proficiency on the EEG responses to phonotactic and semantic dissimilarity regressors. (A) Model weights of the phonotactic TRF for three selected midline EEG channels at peristimulus time latencies from 0 to 600 ms. The results for distinct participant groups are color-coded. Thick lines indicate weights that were significantly different from zero across all subjects of a group (p < 0.05, Wilcoxon signed rank test, FDR corrected). Horizontal black lines indicate a significant effect of group proficiency on the TRF weights (point-by-point one-way ANOVA with FDR correction, p < 0.05). (B) Topographies of the phonotactic TRF weights for five selected time latencies. (C) Cosine distance of the phonotactic TRF for individual L2 participants with the average L1 TRF. The distance was calculated based on all electrodes and time latencies. (D) Model weights of the semantic dissimilarity TRF for selected EEG channels. (E) Topographies of the semantic dissimilarity TRF weights for five selected time latencies. (F) Cosine distance of the phonotactic TRF for individual L2 participants with an average L1 TRF.
