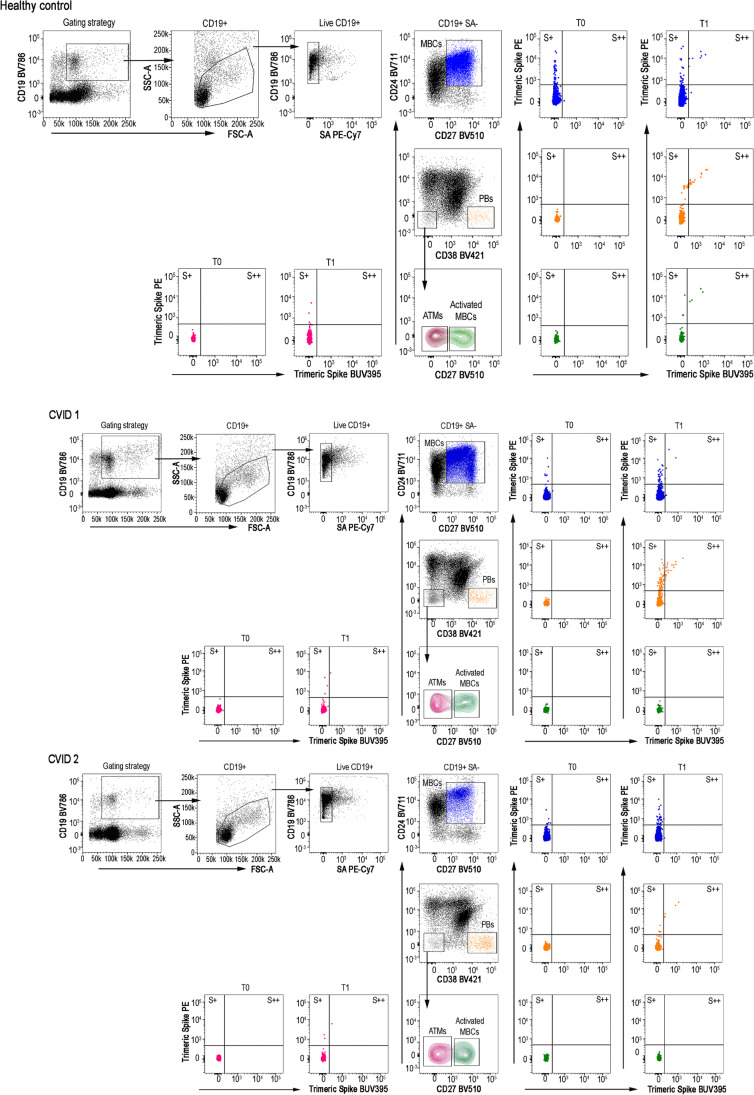
Fig. 2.
Gating strategy to identify S + and S + + MBCs, PBs, ATM , and activated MBCs. One HD and two CVID subjects are shown. We analyzed CD19 + B-cells, included in the live gate. SA PE-Cy7 was used as a decoy probe to gate out streptavidin-binding B-cells from further analysis. MBCs were identified as CD24 + CD27 + CD38-; PBs as CD24-CD27 + + CD38 + + ; ATMs as CD24-CD27-CD38-CD21- -; and activated MBCs as CD24- CD38-CD21-CD27 + . Flow cytometry plots show the staining patterns of SARS-CoV-2 antigen probes in the indicated B-cell populations during the follow-up. S + are B-cells that are Spike-PE + , but Spike-BUV395-. S + + are instead Spike-PE + and SpikeBUV395 + . The color code identifies Spike + and + + in MBCs (blue), PBs (orange), ATMs (dark red) ), and Activated MBCs (green)

