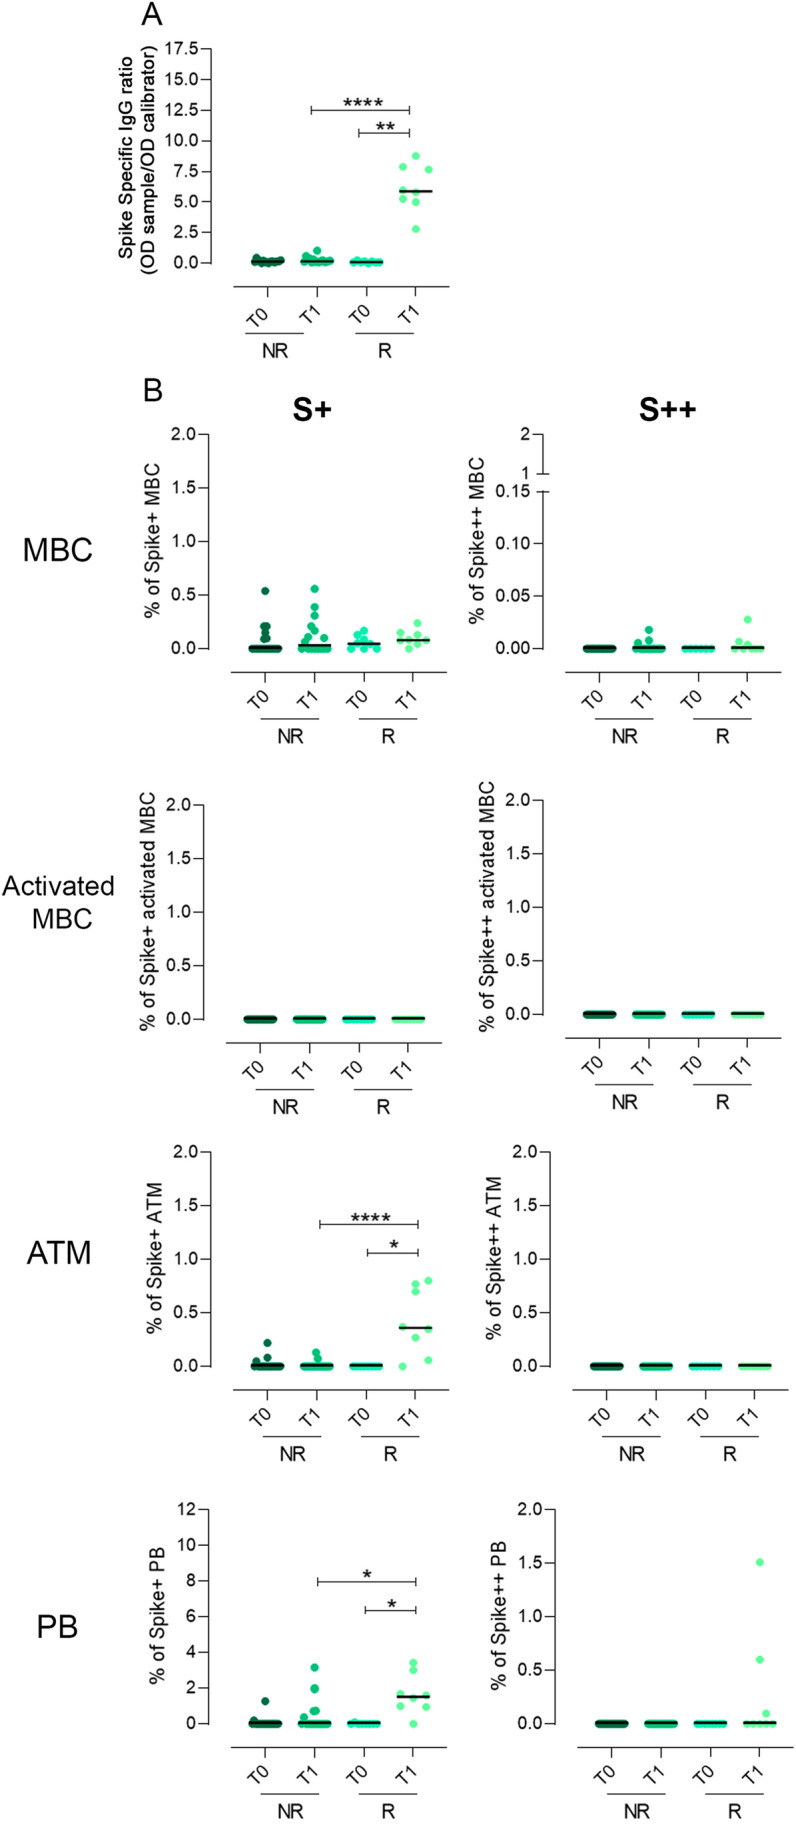
Fig. 4.

Spike-specific IgG, low and high binding capacity B-cells for recombinant Spike protein in CVID who did not develop Spike-specific IgG (NR) and in CVID who developed Spike-specific IgG (R) before (T0) and after two doses of the BNT162b2 vaccine (T1). a Dot plot depicts the levels of Spike-specific IgG. b The frequency of S + and S + + B-cells inside each identified B-cell population, in R and NR CVID patients, is shown. Medians are plotted as horizontal bars and statistical significance were determined using two-tailed Mann–Whitney U-test or Wilcoxon matched-pairs signed-rank test. *P < 0.05, **P < 0.01, ****P < 0.0001. N = 16 NR and N = 8 R
