
Fig. 7.
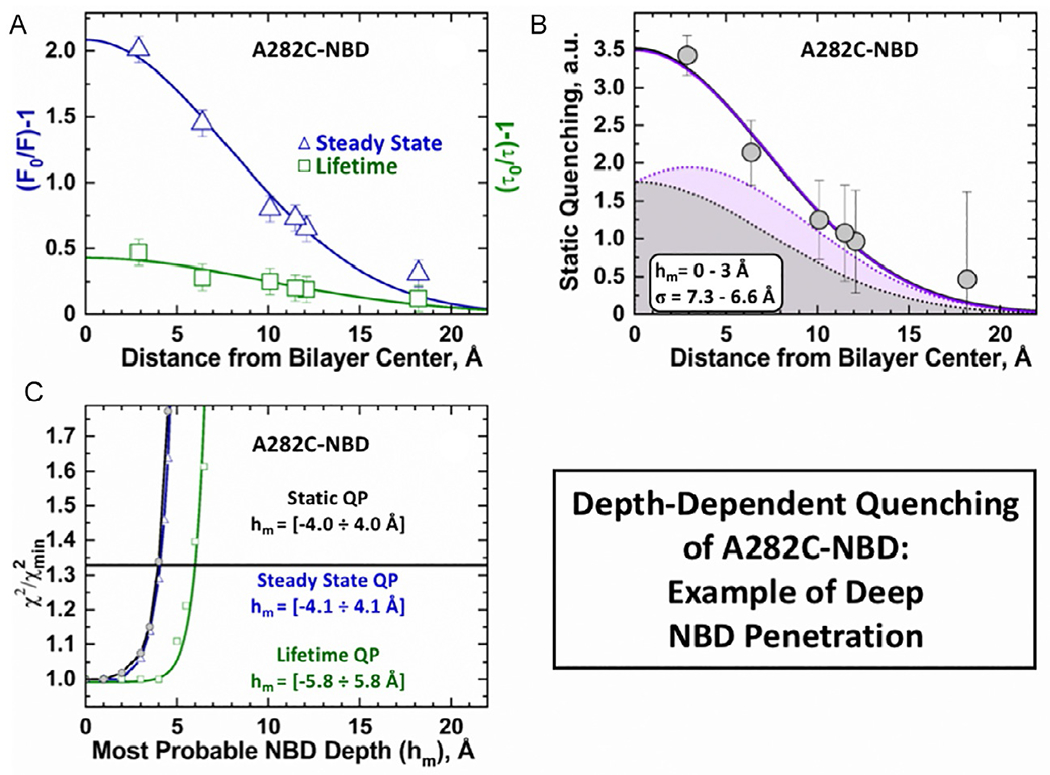
Application of DA to depth-dependent fluorescence quenching of deep penetrating probe in A282C-NBD mutant [Kyrychenko et al., 2018]. The steady-state (panel A, triangles) and time-resolved data (panel A, squares), as well as the static (panel B) quenching profiles were obtained as described in Fig. 6. Solid shapes represent two examples of individual solutions for a single-leaflet quenching profile (G(h) in Eq. 1) with hm = 0Å (gray) and hm = 3Å (purple). Both solutions produce essentially overlapping two-leaflet quenching profiles (correspondingly colored solid lines that go through the data). (C) Support-plane analysis of the robustness of the determination of the parameter for the most probable depth of the NBD dye (see text for details).