. 2021 Sep 15;12(40):13506–13512. doi: 10.1039/d1sc02527a

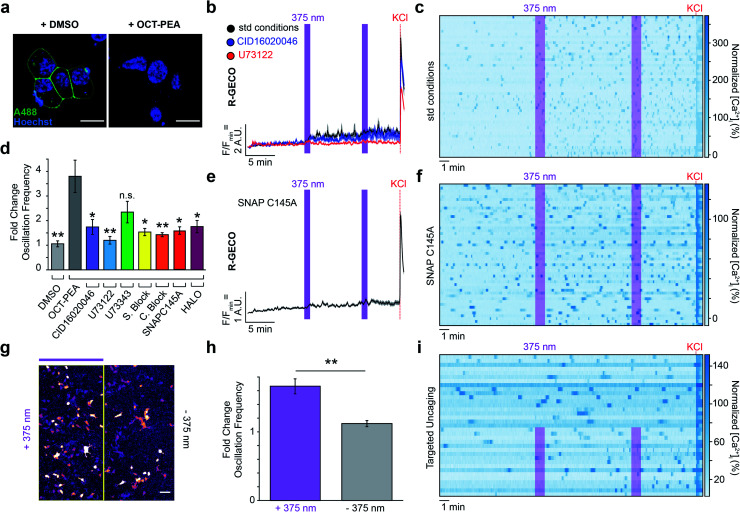
Fig. 4. Targeted uncaging of OCT-PEA on the INS-1 cell surface. (a) Pre-incubation with DMSO (0.1% v/v, 2 h) maintains surface SNAP-tag labelling (A488, green, left), whereas pre-incubation with OCT-PEA (5 μM, 2 h) abolished dye labelling (right). Nuclei stained with Hoechst-33342 (blue). Scale bar = 10 μm. (b) Fluorescent Ca2+ imaging using R-GECO showed that OCT-PEA (5 μM, 2 h, black, N = 352, T = 8) increased the average [Ca2+]i in INS-1 cells. Overlaid with averages in the presence of a GPR55 antagonist (CID16020046, 5 μM, blue, N = 212, T = 4) or PLC inhibitor (U73122, 5 μM, red, N = 173, T = 4), which reduced the effect of OCT-PEA. UV-A irradiation (375 nm) shown as purple bars, and KCl (25 mM) was applied at the end of each experiment. (c) Heat map showing individual Ca2+ traces from fifty representative cells which were pre-incubated with OCT-PEA (5 μM, 2 h). Cells normalized to the KCl response. (d) Comparison bar graph of fold change in oscillation frequency in response to OCT-PEA uncaging across different conditions. Uncaging in the presence of GPR55 antagonist (CID16020046, 5 μM, purple, N = 212, T = 4), PLC inhibitor (U73122, 5 μM, blue, N = 173, T = 4), SNAP-Surface® Block (20 μM, yellow, N = 278, T = 5), SNAP-Cell® Block (10 μM, orange, N = 248, T = 4), pDisplay™-SNAPC145A (red, N = 244, T = 5) or pDisplay™-HALO (magenta, N = 330, T = 4) reduced the probe's effect on oscillation frequency. The inactive PLC inhibitor analogue (U73343, 5 μM, green, N = 357, T = 6) did not block the effect of OCT-PEA. Vehicle treatment (DMSO, 0.1% v/v, grey, N = 247, T = 4) did not change the oscillation frequency in response to UV-A irradiation. (e and f) Uncaging OCT-PEA in INS-1 cells transfected with pDisplay™-SNAPC145A reduced the effect of the probe, displayed as (e) average trace of all cells and (f) heat map of representative traces from fifty cells, normalized to the KCl response. (g–i) Targeted uncaging on half of the field of view, displayed as (g) uncaging ROI, (h) bar graph comparing fold change in oscillation frequency between irradiated (N = 145, T = 5) and nonirradiated regions (N = 132, T = 5), and (i) heat map of representative traces from one trial, normalized to KCl response. Error bars = mean ± SEM. *P < 0.05, **P < 0.01, ns = P > 0.05, P values reported in Table S3..

Fig. 4