
Figure 1.
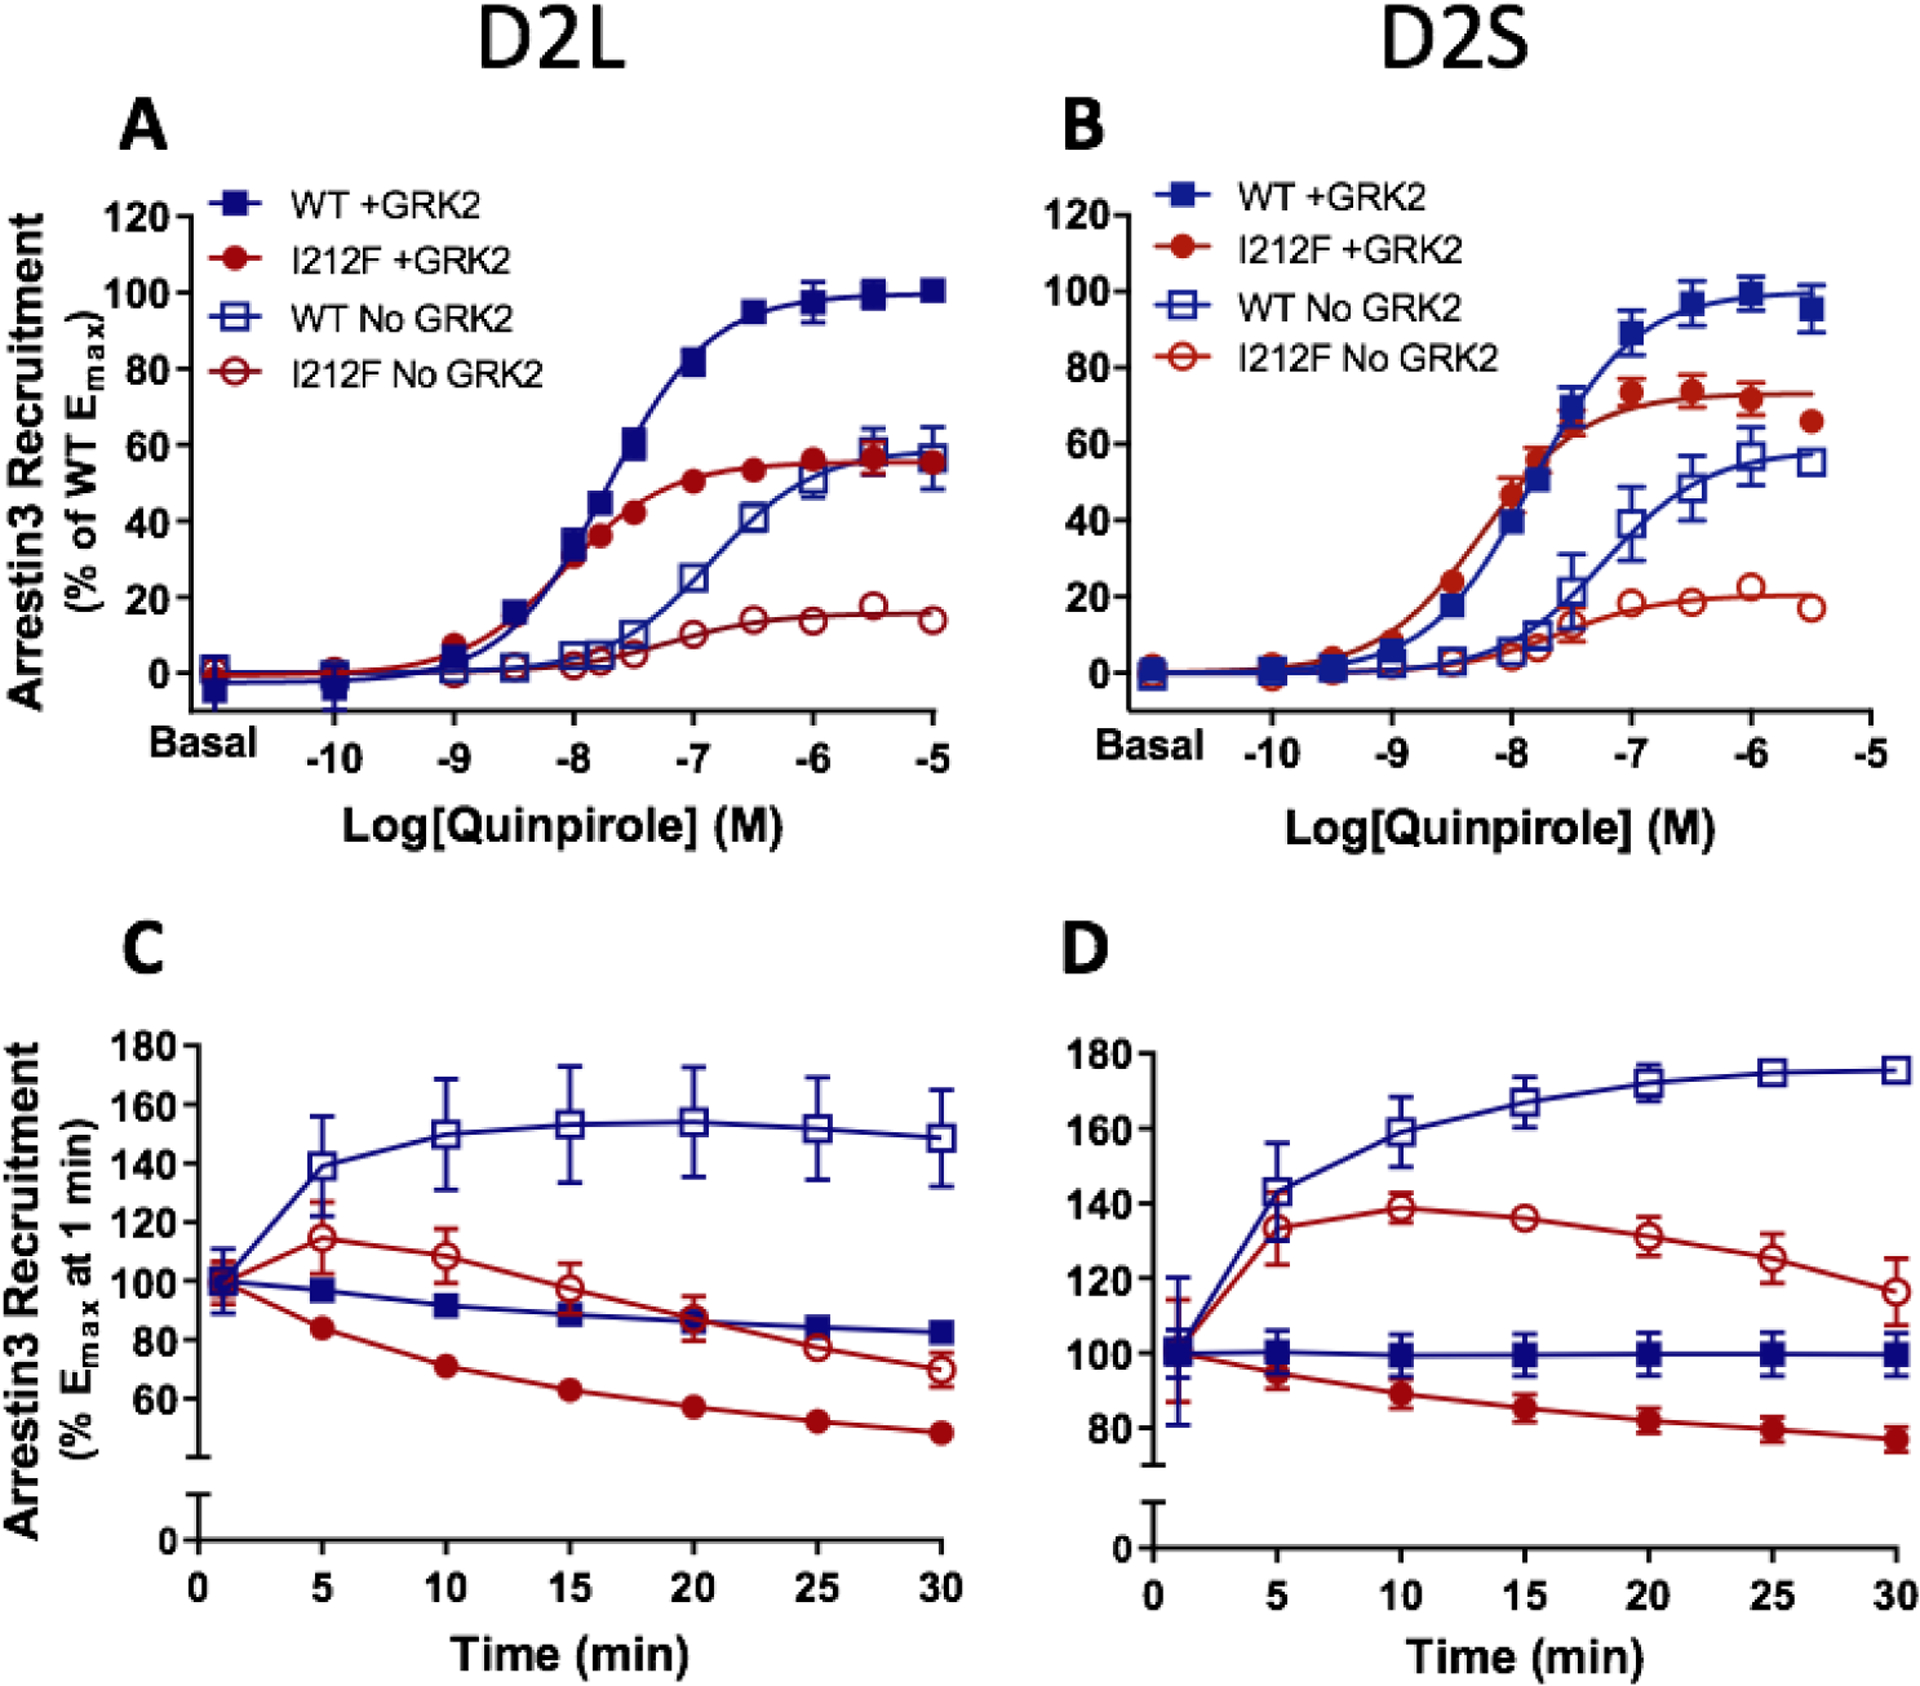
Dose-response curves for quinpirole-induced arrestin3 recruitment mediated by D2L/S-WT and D2L/S-I212F. Arrestin3 recruitment was measured in HEK293 cells co-transfected with GRK2 (+ GRK2) or nonspecific plasmid DNA (No GRK2). Values plotted are the means ± SD of 3–4 independent experiments performed in quadruplicate. A and B, quinpirole concentration-response curves measured at 10 min. Data from each independent experiment were normalized by subtracting the baseline and expressed as a percentage of maximum arrestin3 recruitment by D2-WT+GRK2. Data for + GRK2 are from the dataset described in van der Weijden et al. (8), where results were shown after 20 min of agonist stimulation. C and D, change in Emax values over 30 min, with each condition normalized to Emax for that condition at 1 min. Data for + GRK2 were previously described in van der Weijden et al. (8).