
Figure 2.
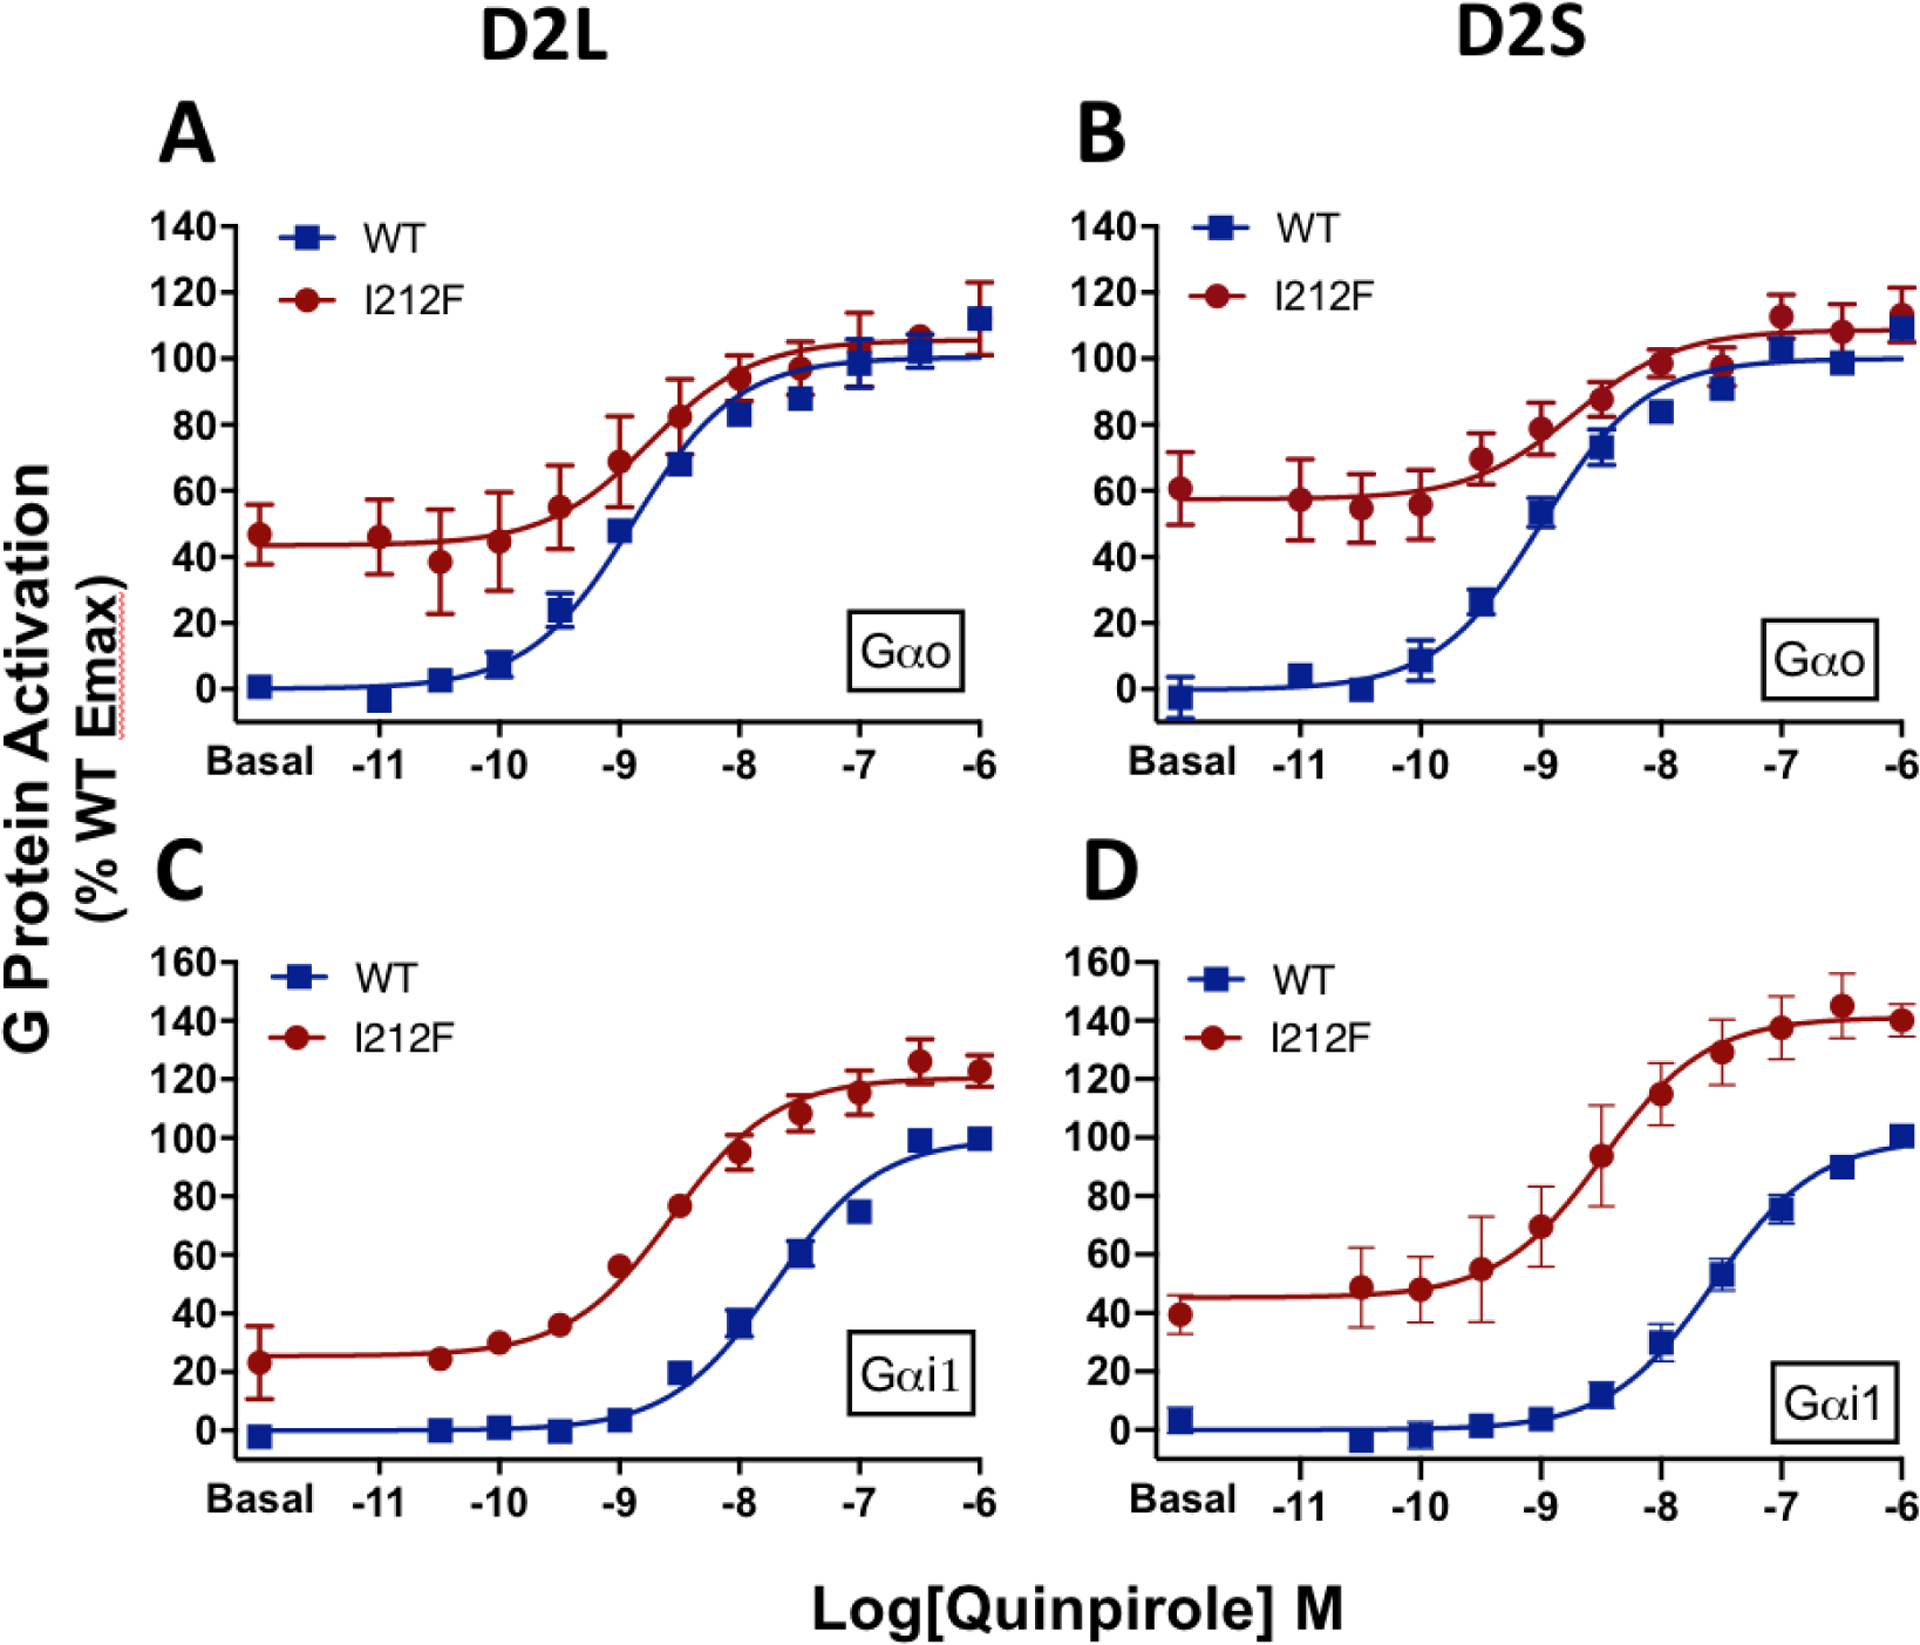
Concentration-response curves for Gαi/o protein activation mediated by D2-WT and D2-I212F in response to stimulation with quinpirole. Results are expressed as the percentage of maximum G protein activation by D2-WT, measured 10 min after adding coelenterazine h. A, Activation of GαoA by D2L-WT/I212F, B, Activation of GαoA by D2S-WT/I212F, C, Activation of Gαi1 by D2L-WT/I212F, and D, Data from van der Weijden et al. (8) for activation of Gαi1 by D2SWT/I212F. Values plotted represent means ± SD of three (panel C) or four (panels A, B, D) independent experiments performed in quadruplicate.