. 2021 Aug 3;12(40):13292–13300. doi: 10.1039/d1sc01560e

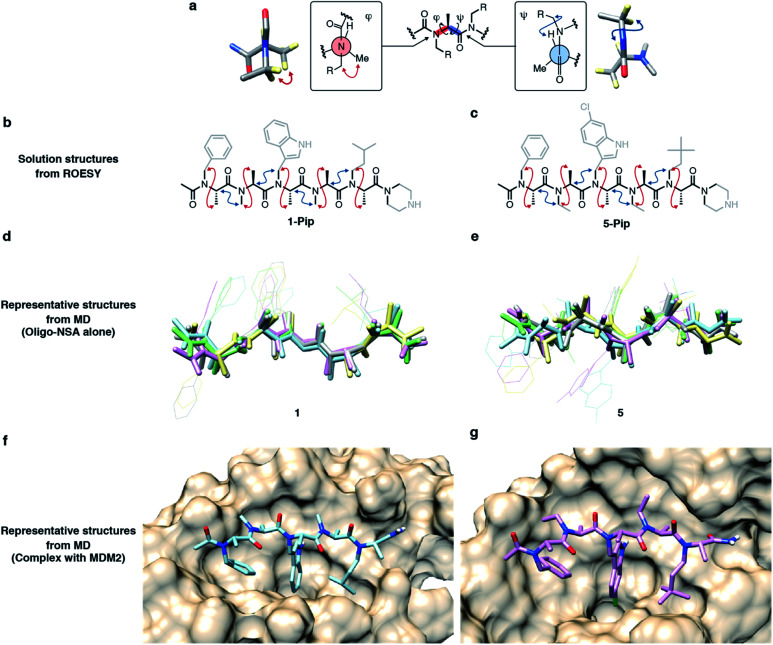
Fig. 5. Structural analysis of MDM2-binding oligo-NSAs. (a) Schematic illustration of the preferred conformations via pseudo-1,3-allylic strains. Red and blue arrows indicate spatially proximal protons via rotational restrictions of the backbone dihedral angles. Part of the three-dimensional model structure is shown next to each Newman diagram to visualize the proximities of the protons. (b and c) Summary of spatially proximal protons in 1-Pip (b) and 5-Pip (c) obtained from ROESY measurements. Protons with NOEs that suggest rotational restrictions about φ (red arrows) and ψ (blue arrows) are indicated. (d and e) Overlay of five representative structures of 1 (d) and 5 (e) during MD simulations. Dominant conformations were determined by clustering analysis, and the backbones of the representative structures from each of the top five clusters were overlaid. (f and g) Representative structure of 1 (shown in cyan in (f)) and 5 (shown in pink in (g)) in complex with MDM2 during the MD simulations. The representative structures were determined by clustering analysis.

Fig. 5