
Figure 2.
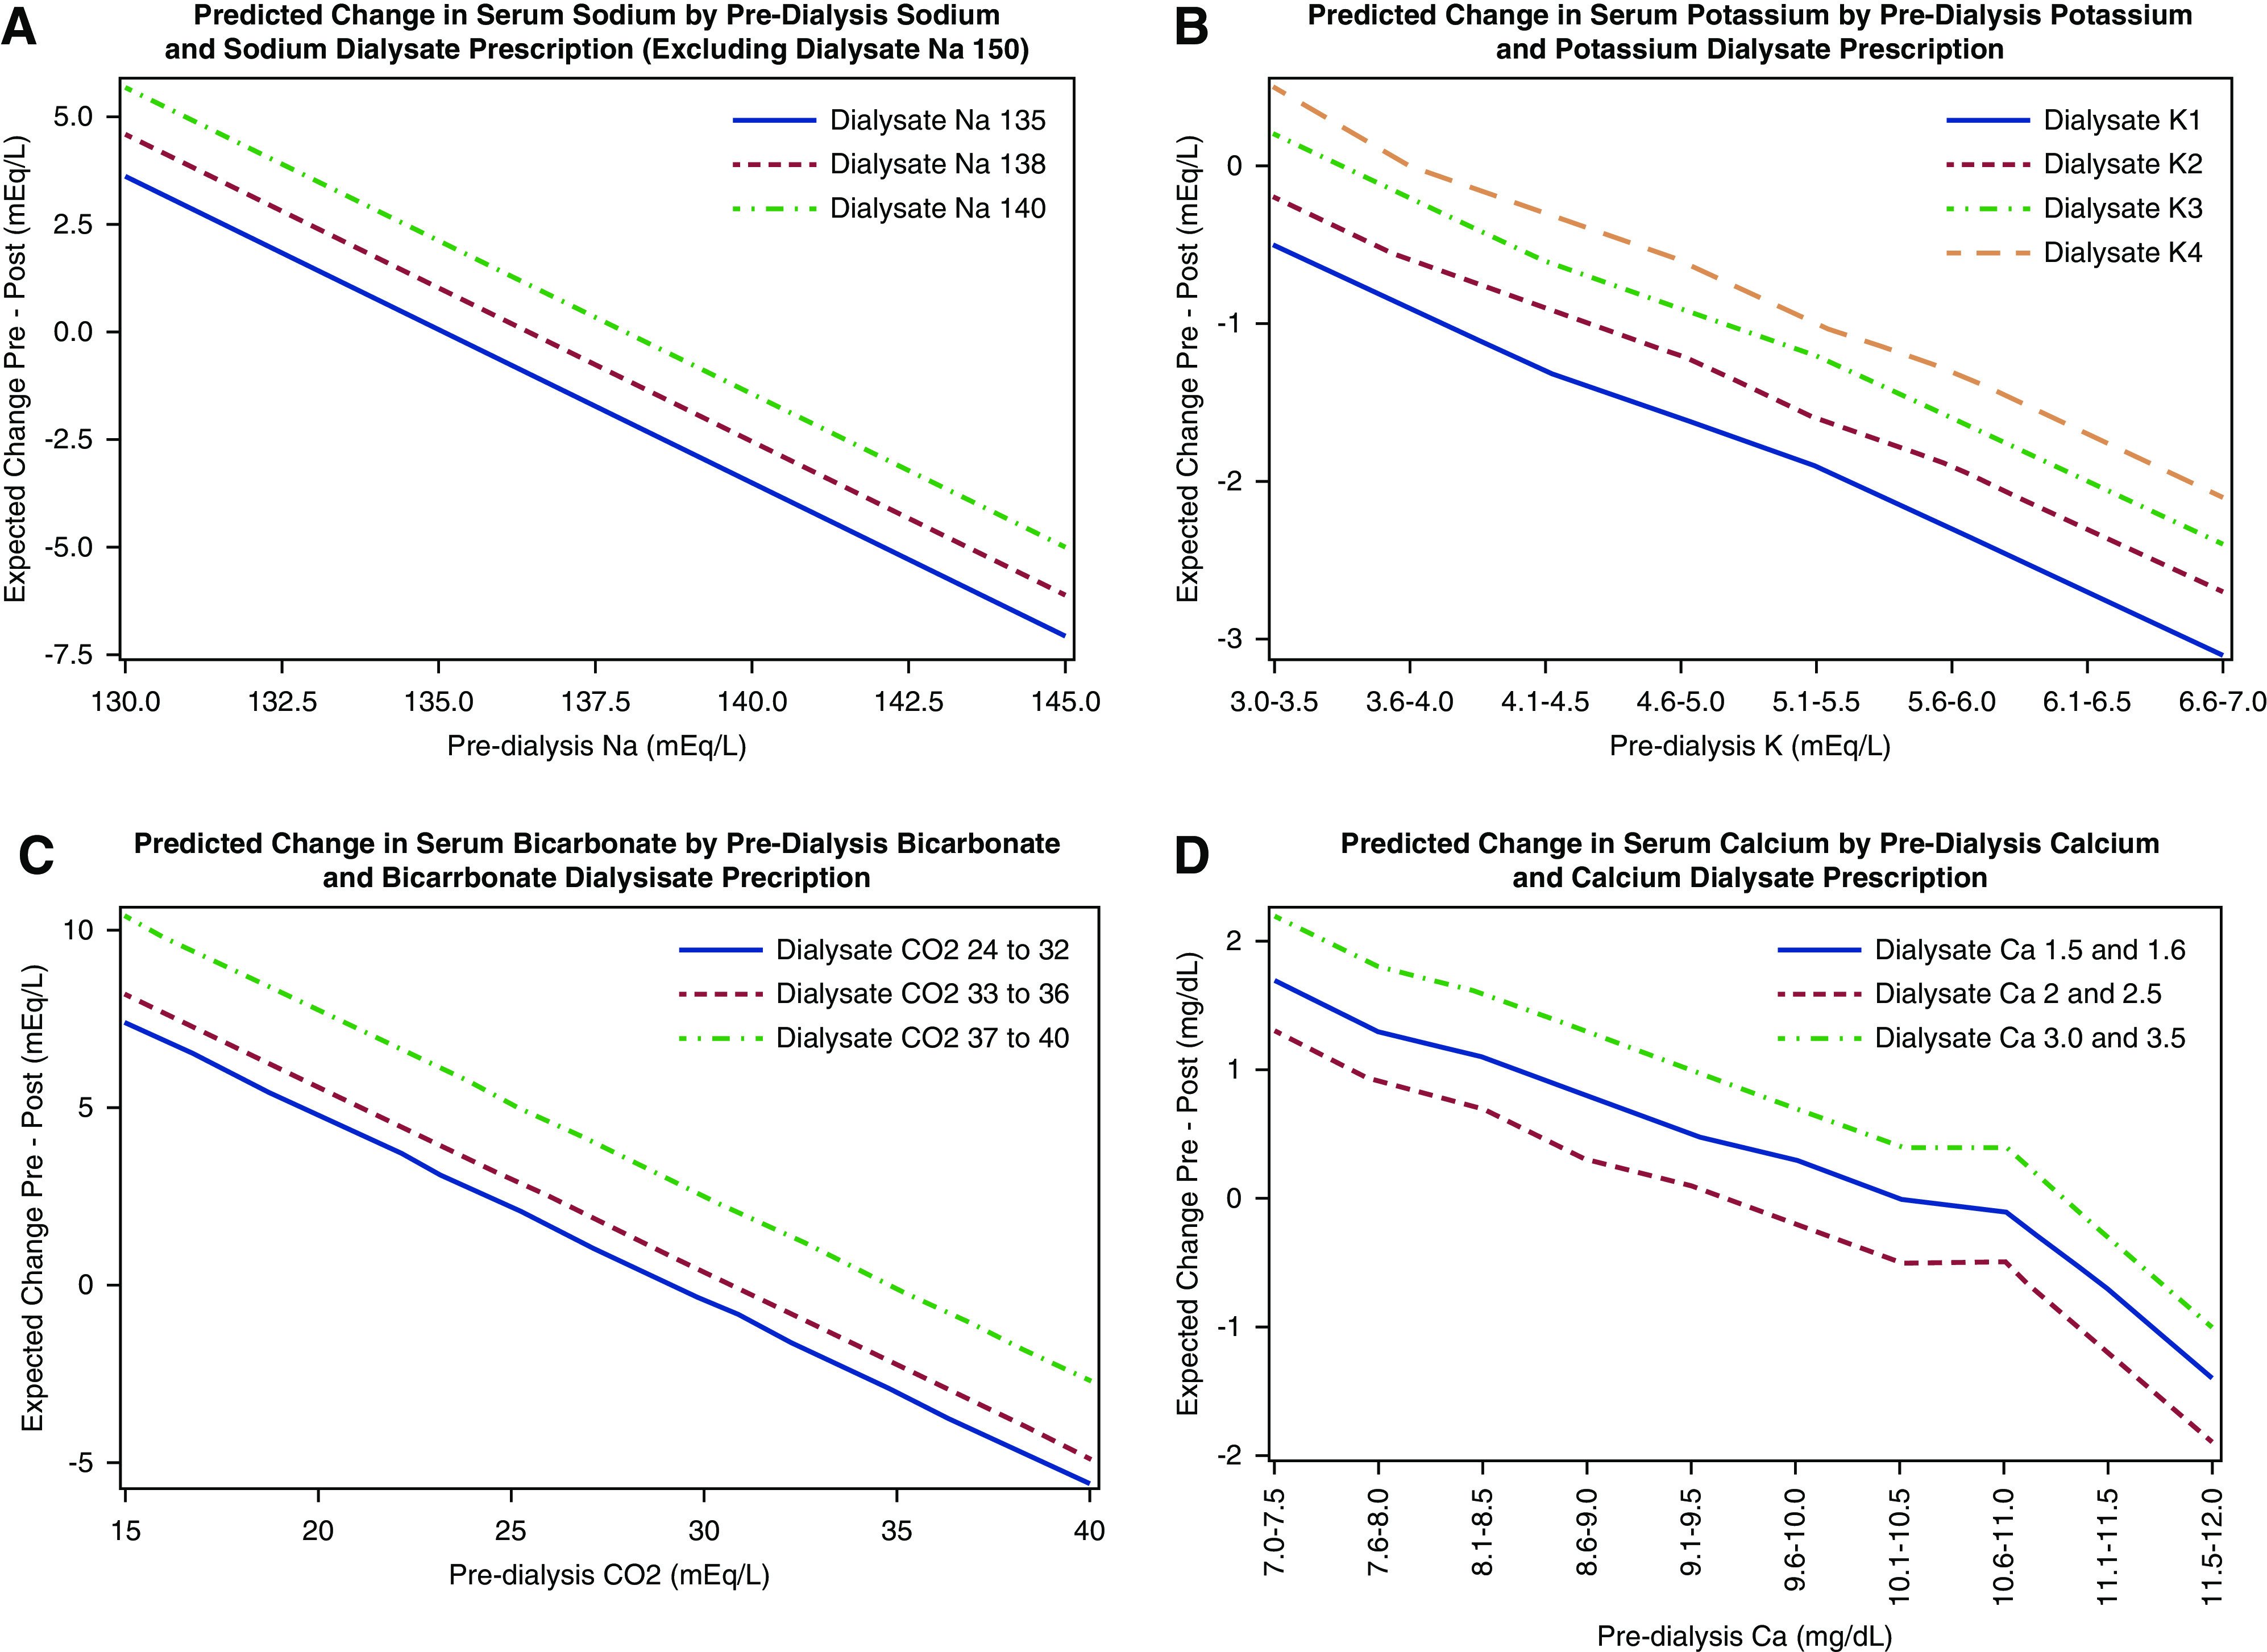
Predicted change in (A) serum sodium, (B) serum potassium, (C) serum bicarbonate, and (D) serum calcium according to baseline serum electrolyte and dialysate prescription (mEq/L). Each graph is on the basis of a model that adjusted for the prehemodialysis (HD) concentration of the electrolyte of interest. For instance, the predictive graph for serum sodium is adjusted for pre-HD serum sodium.