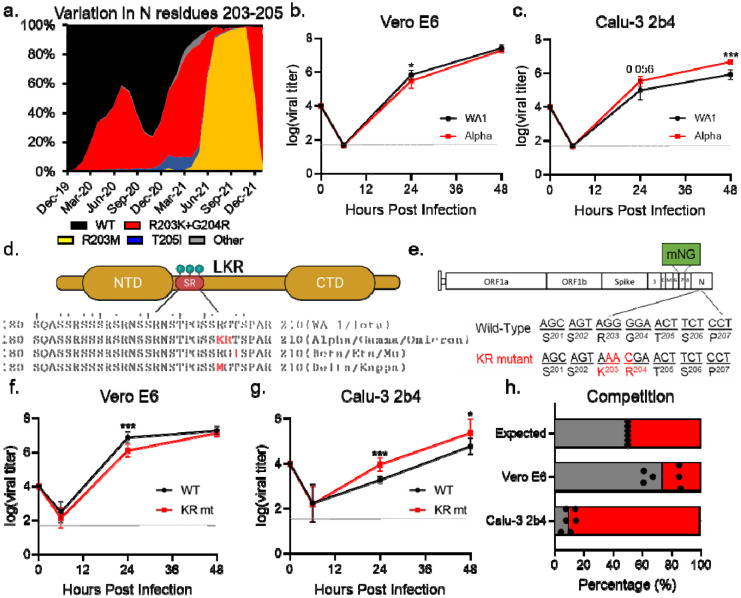
Fig 1. The KR mt enhances SARS-CoV-2 replication.
(A) Amino acid frequencies for nucleocapsid residues 203–205 in SARS-CoV-2 sequences reported to the GISAID, binned by month of collection and graphed as percent of total sequences reported during that period. (B-C) Viral titer from Vero E6 (B) or Calu-3 2b4 cells (C) infected with WA-1 (black) or the alpha variant (red) at an MOI of 0.01 (n≥6). (D). Schematic of the SR domain of SARS-CoV-2 nucleocapsid. Variable residues are displayed as red text within the sequence of their corresponding lineages. Phosphorylated residues are indicated by a †. (E) Schematic of the SARS-CoV-2 genome, showing the creation of the KR mutation and the replacement of ORF7 with the mNG reporter protein. (F-G) Viral titer of Vero E6 (F) or Calu-3 2b4 (G) cells infected with WT (black) or the KR mt (red) at a MOI of 0.01 (n=9). (H) Competition assay between WT (gray) and KR mt (red) in Vero E6 or Calu-3 2b4 cells infected at a 1:1 input ratio with an MOI of 0.01 (n=6). Titer data are the mean ± s.d. For competition, individual replicates are graphed as points, while the mean percentage of each virus is displayed as a bar graph. Statistical significance was determined by two-tailed student’s T-test with p≤0.05 (*), p≤0.01 (**), and p≤ 0.001 (***). Grey dotted lines are equal to LOD.

