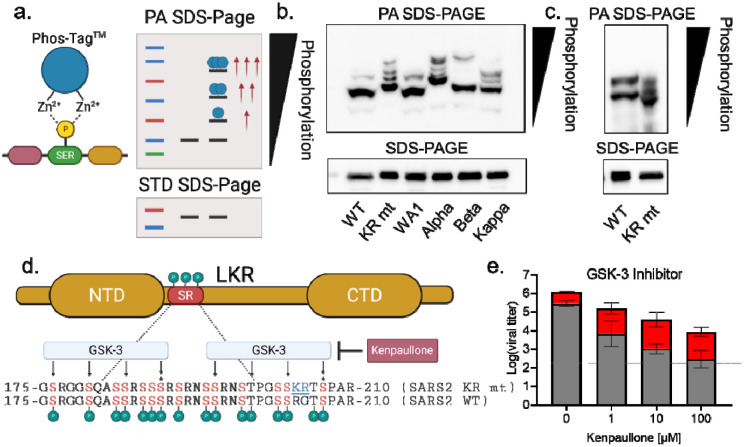
Fig 4. The KR mt increases N phosphorylation to enhance infection.
(A) Schematic of phosphate-affinity (PA) SDS-PAGE. (B) Whole cell lysates from Calu-3 2b4 cells infected with SARS-CoV-2 WA-1-mNG (WT), the KR mt, WA-1, alpha, beta, and kappa variants were analyzed by PA SDS-Page (top) or standard SDS-PAGE (bottom) followed by blotting with an N-specific antibody (n=3). (C) Whole cell lysates from Vero E6 cells infected with WT or the KR mt and analyzed by PA-SDS-Page (top) or standard SDS-Page (bottom) followed by blotting with an N-specific antibody (n=3). (D) Schematic of phosphorylation by GSK-3 of the SR domain of SARS-CoV-2 N. Residues targeted by GSK-3 are indicated with arrows and priming residues designated by a ‘*’. (E) Viral titer 48 hours post infection from Calu-3 2b4 cells infected with WT SARS-CoV-2 (gray) or the KR mt (red) at an MOI of 0.01. Cells were treated with the indicated concentrations of kenpaullone prior to and during infection. Bars are the mean titer ± s.d. (n=4). Significance indicates a change in mean titer difference and was determined by student’s T-Test with p≤0.05 (*) and p≤0.01 (**).

