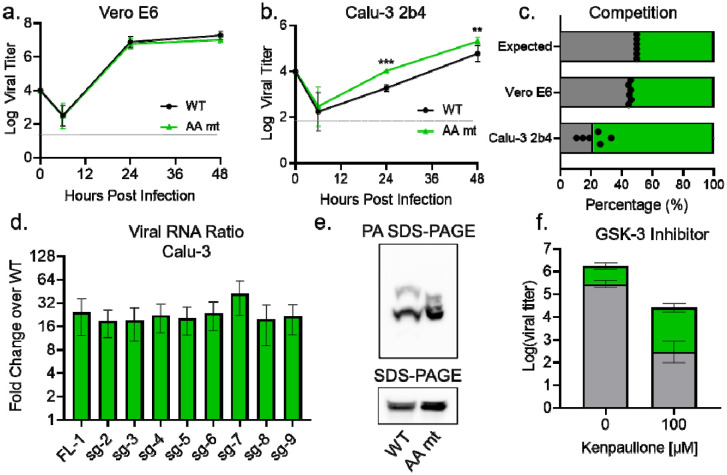
Fig 5. The AA mt mimics the KR mt’s enhancement of SARS-CoV-2 infection.
(A-B). Viral titer from Vero E6 (A) or Calu-3 2b4 (B) cells infected at an MOI of 0.01 with WT (black) or the AA mt (green) (n=9). (C) Competition assay between WT (gray) and the AA mt (green) in Vero E6 and Calu-3 2b4 cells at a 1:1 input ratio and an MOI of 0.01 (n=6). (D) Full-length and subgenomic transcript levels 24 hours post infection from Calu-3 2b4 cells infected with WT or the AA mt. Transcripts were normalized to 18S ribosomal RNA and graphed as fold change in the AA mt relative to WT (n=3). (E) Whole cell lysates from Calu-3 2b4 cells infected with WT or the AA mt and analyzed by PA SDS-Page (top) and standard SDS-Page (bottom) followed by blotting with an N-specific antibody (n=3). (F) Viral titer 48 hours post infection from Calu-3 2b4 cells infected with WT (gray) or the AA mt (green) at an MOI of 0.01. Cells were treated with the indicated concentrations of kenpaullone prior to and during infection (n=4). Graphs represent mean titer ± s.d. Significance was determined by two-tailed student’s t-test with p≤0.01 (**) and p≤ 0.001 (***). Grey dotted lines are equal to LOD.

