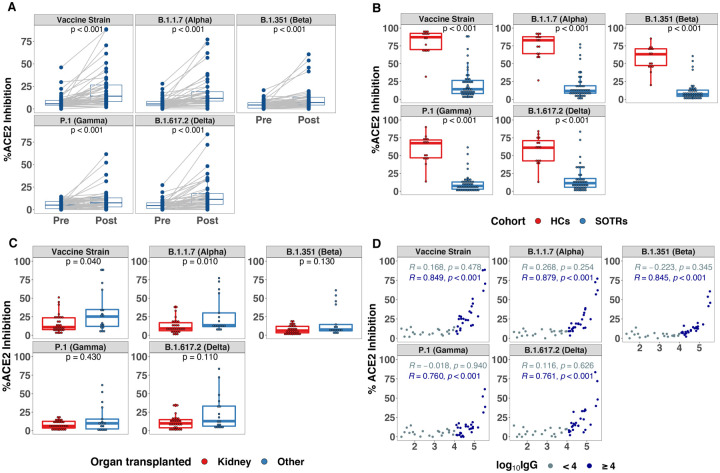
Figure 2. SARS-CoV-2 Pseudoneutralization After a Third Dose of COVID-19 Vaccine in SOTRs.
A. Pseudoneutralization of full-length SARS-CoV-2 Spike variants (indicated in top header of each panel) before and after a third dose of vaccine among SOTRs.
B. Pseudoneutralization of full-length SARS-CoV-2 Spike variants (indicated in top header of each panel) in SOTRs (n = 47) after a third dose of vaccine compared to fully vaccinated healthy controls (n = 15).
C. Comparison of pseudoneutralization of full-length SARS-CoV-2 Spike variants (indicated in top header of each panel) in SOTRs who received kidney (n = 30) and non-kidney (n = 17) transplant.
D. Correlation between total SARS-CoV-2 Spike IgG and pseudoneutralization of full-length SARS-CoV-2 Spike variants among SOTRs receiving a third dose of vaccine.
In panel A-C, the boxplots represent the IQR. The median is represented by a horizontal line in the box. The lower and upper whiskers represent 1.5x the IQR beyond the quartiles. Each dot represents an individual sample. Statistical differences between groups were determined by Wilcoxon signed rank test for panel A, and Wilcoxon rank sum test for panel B and C. Pearson correlation coefficient were generated for panel D. P-values of <0.01 were considered significant after Bonferroni correction.

