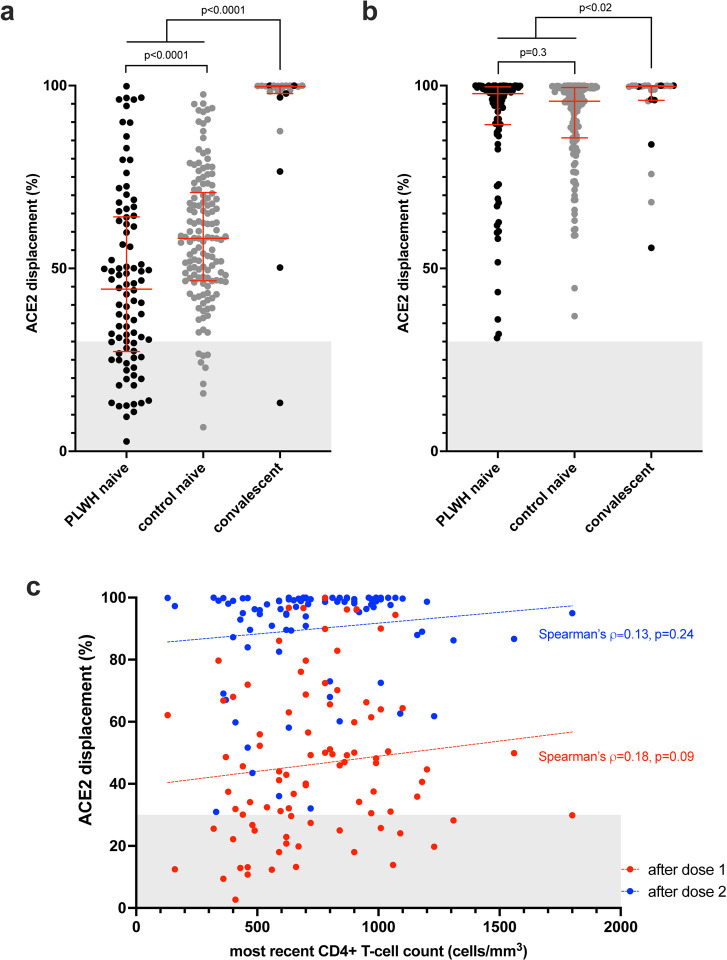
Figure 2: Ability of vaccine-induced antibodies to block ACE2-receptor binding following one and two COVID-19 vaccine doses.
Panel A: ACE2 displacement activities of plasma antibodies following one dose of a COVID-19 vaccine in PLWH (black circles) and controls (grey circles) who were COVID-19 naive at study entry. Convalescent participants (those with anti-N antibodies at study entry) are colored as above. Red bars and whiskers represent median and IQR. Grey shaded area denotes the approximate range of values observed in pre-vaccine plasma from COVID-19 naive participants (see Supplemental Figure 1). P-values were computed using the Mann-Whitney U-test and are uncorrected for multiple comparisons. Panel B: ACE2 displacement activities after two vaccine doses, colored as in A. Panel C: Correlation between most recent CD4+ T-cell count and ACE2 displacement activities after one dose (red circles) and two doses (blue circles). Dotted lines are to help visualize the trend.

