
Figure 1: RBD IgG index values over time among patients on dialysis in the overall cohort and by prior SARS-CoV-2 infection (A), by vaccine type (B), by age group (C), and diabetes status (D).
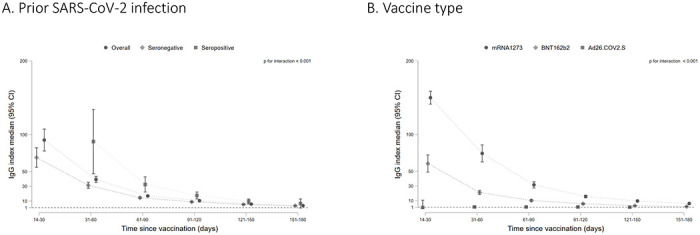
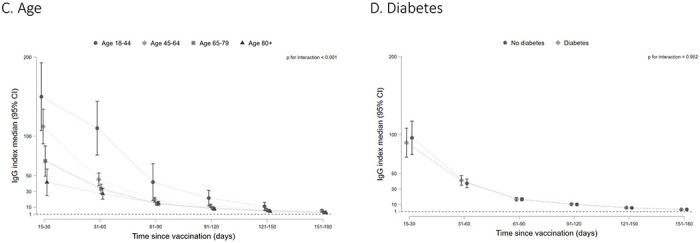
Among patients who seroconverted on the total RBD Ig assay, median RBD IgG index values are graphed by time since vaccination, with error bars representing 95% CI for the median value. A missing time point indicates insufficient data for the subgroup at that time point. An index value of 1 corresponds to 21.8 BAU/mL on the WHO Standard. Index values < 1 indicate a ‘negative’ result on the assay. P values test for interaction by subgroup and significant p values indicate that the trajectory of the response differed by the subgroup depicted.