
Figure 2: RBD IgG index values among cases versus controls.
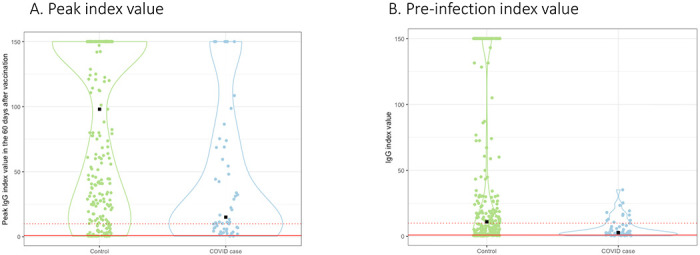
Violin plots represent peak RBD IgG values obtained within 60 days prior to vaccination (A) and the IgG values obtained in immediate period preceding infection are graphed (B) by case versus control status. Median time between pre-breakthrough IgG values and COVID-19 diagnosis was 21 days (25th, 75th percentile: 14-28 days); the corresponding time for controls was 21 days (25th, 75th percentile 12, 27 days). Median peak RBD IgG values were 98.0 (22.3, 150) versus 15.1 (6.3, 71.5), and pre-breakthrough values were 11.0 (2.3, 47.8) versus 2.8 (1.2, 8.6) for controls versus cases respectively. All cases had index values < 36.