
FIGURE 4.
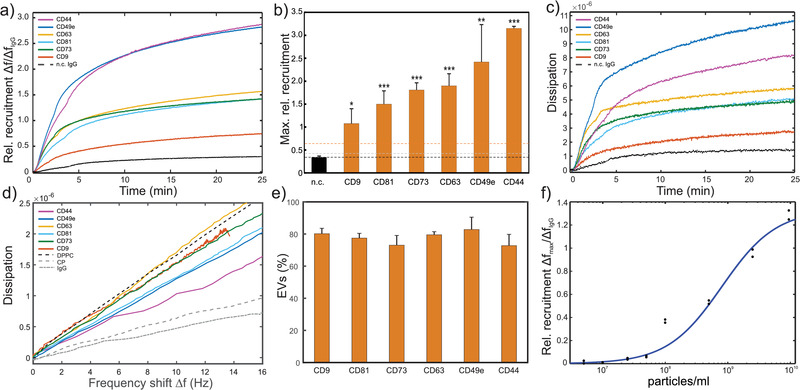
QCM analysis of a CD9, CD44, CD49e, CD63, CD73 and CD81 positive primary UC‐MSC EV preparation. (A) Relative recruitment for the different marker‐specific antibodies (anti‐CD9, anti‐CD44, anti‐CD49e, anti‐CD63, anti‐CD73, and anti‐CD81 antibodies) and a control anti‐DNP IgG (dashed line) calculated from the binding curves (frequency shift) normalized to the total number of immobilized antibodies, respectively. (B) Maximal rel. recruitment levels for each marker. Bars represent means ± standard deviation of experimental replicates. The black dashed line represents the mean of all negative controls (n.c.). Grey and orange dashed lines represent the mean of all negative controls plus 3 and 10 standard deviations, respectively. All data relates to the third harmonic frequency of the 5 MHz quartz crystals used. Statistical analysis was performed using ordinary one‐way Anova, Dunnett's multiple comparisons test. *... P < 0.05; **... P < 0.01; ***...P < 0.001, N = 3‐6. (C) Dissipation monitoring revealed an increase in dissipative energy loss upon sample binding to the sensor surface. (D) Frequency shift vs dissipation signals obtained from (a) and (c) through eliminating time. Additionally, similar analysis of DPPC vesicles and two protein samples (CP and IgG) is displayed. (E) Marker specific EVs included in our UC‐MSC EVs as determined via Equations (3), (4) from the slope of frequency shift vs dissipation curves as in (d). Bars represent means ± standard deviation of experimental replicates (N = 3). (F) Response curve of biotin‐anti‐CD73 IgG functionalized sensors at a range of particle concentrations