
FIGURE 3.
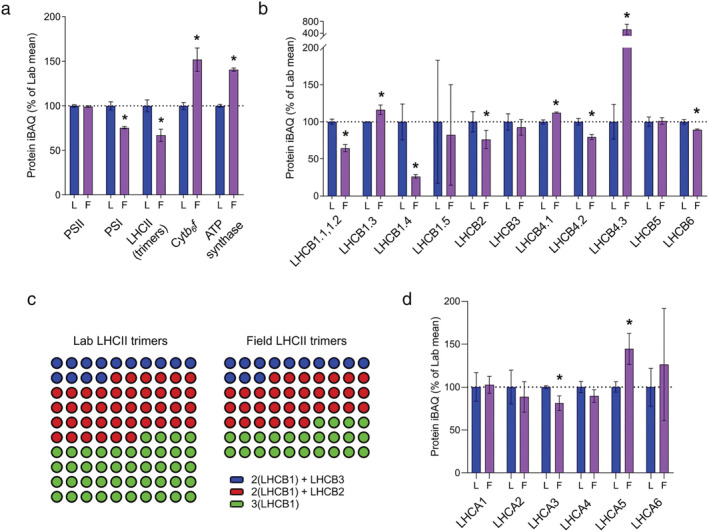
MS‐based quantification of light harvesting proteins and photosynthetic complexes from Arabidopsis plants cultivated in the lab and field. (a) Relative abundances in Lab (L) and Field (F) thylakoids of PSII, PSI, LHCII, cytb 6 f, and ATP synthase, expressed as a percentage of the mean Lab iBAQ values. The bars represent the means of three independent peptide preparations (n = 3), derived from pooled thylakoid samples, which were subject to MS analysis in triplicate in a randomized order. Error bars indicate mean ± SD. Significant differences between conditions were determined by a modified Welch's t test (*q < .05). (b) Relative abundances of LHCII subunits, with results represented as in (a). (c) Comparison of the numbers of LHCII trimers, shown as dots, in Lab and Field thylakoids and the distribution of trimer types. The number of trimers in Lab thylakoids is set to 100, and the trimers are categorized into trimers containing LHCB3 (blue dots), LHCB2 (red dots), or only LHCB1 (green). Abundance values for all LHCB1 isoforms (LHCB1.1, 1.2, 1.3, 1.4, and 1.5) were summed. (d) Relative abundances of LHCI isoforms, with results represented as in (a)