
FIGURE 7.
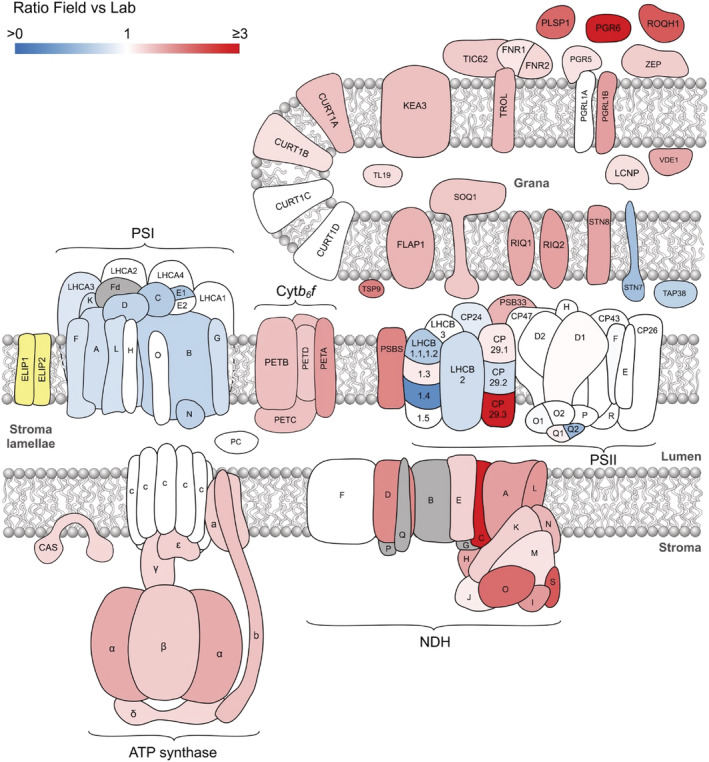
Schematic summary of the relative abundances of all thylakoid proteins considered in this study. Proteins are colored according to the criteria stated in Figure 6. In addition, proteins only detected in Field thylakoids are yellow and those not identified by our MS analysis are gray