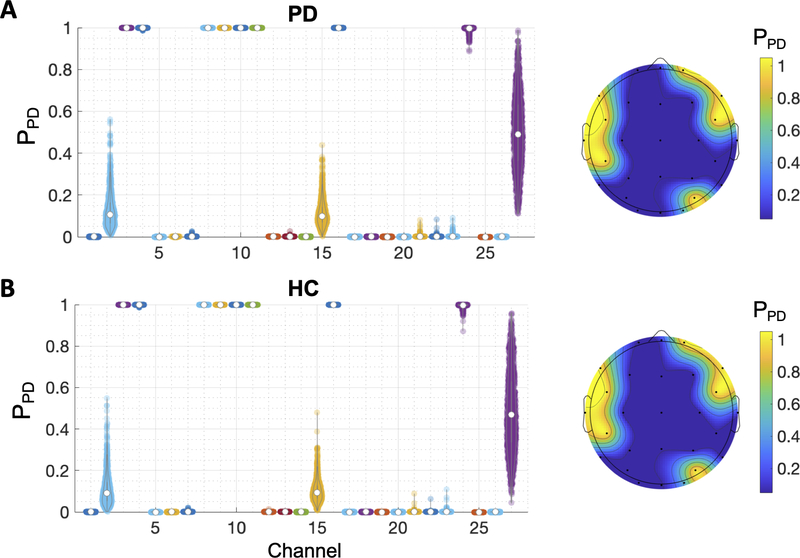
Fig. 5.
The distribution of PPD of the EEG samples when the phase of one EEG channel was randomized. Higher PPD indicates the sample is more likely from PD. The average values of the distributions are presented in the topographical scalp maps on the right. (A) Results from the PD EEG samples (N = 1200). (B) Results from the HC EEG samples (N = 1260).

