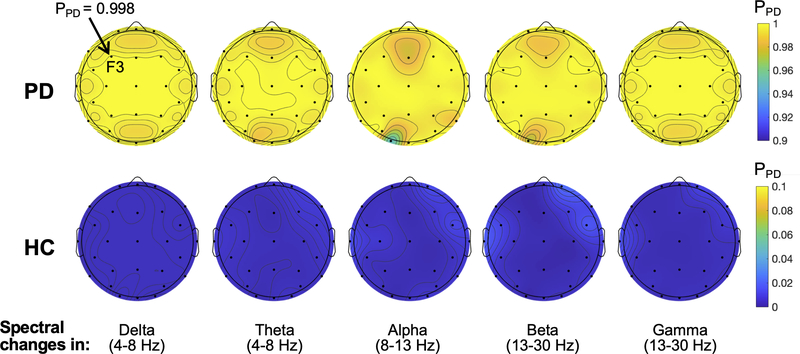
Fig. 7.
Effects of regional spectral power change on the CRNN model performance. The spectral power in the delta, theta, alpha, beta, or gamma frequency band was changed at each electrode at a time by 100%, and PPD of the EEG samples were estimated by the model. The mean PPD across the EEG samples is presented in each topoplot with the colour bar on the righthand side showing the probability scale. The topoplots in the first and second rows demonstrate the results from the PD and HC EEG samples, respectively.

