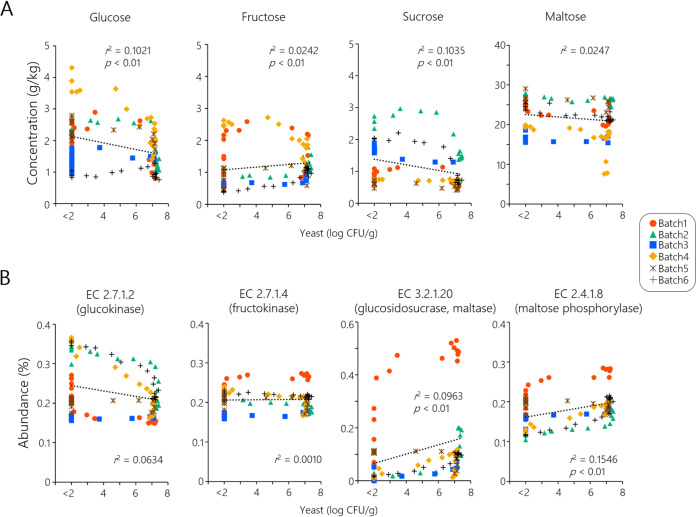
FIG 5.
(A and B) Relationship between yeast populations in wheat sourdough and (A) sugar compositions or (B) sugar-associated functions of bacterial communities. The P value represents the significant difference between the sample group of high-yeast populations (≥7.0 log CFU/g) and that of low-yeast populations (≤2.0 log CFU/g) by Mann-Whitney U test. (A) Sugar concentrations against yeast populations. (B) Abundance of sugar-associated bacterial functions predicted by PICRUSt2 against yeast populations.

