
FIG 1.
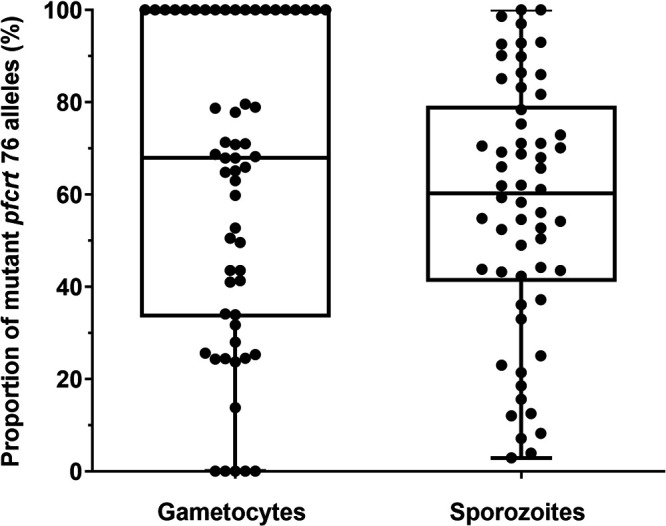
Box plot of mutant pfcrt 76 alleles in gametocyte and sporozoite samples. The dots represent the observed proportions of mutant pfcrt 76 alleles in the gametocyte samples and the observed average proportions of mutant pfcrt 76 alleles in the sporozoite samples. Box plots represent the median, 25th, and 75th percentiles and the minimum and maximum.