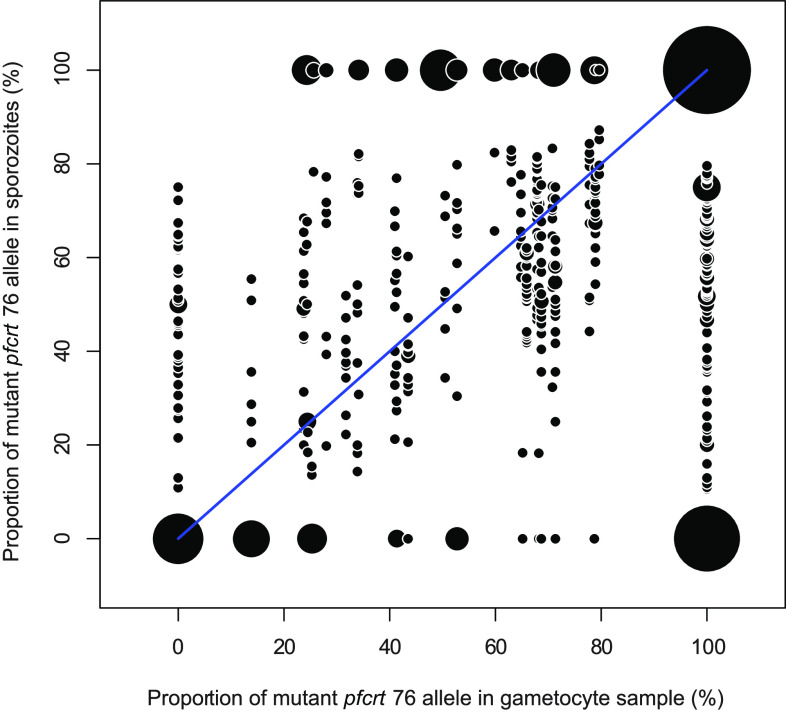
FIG 2.
Dispersion of the proportions of mutant pfcrt 76 alleles in gametocyte samples and in paired sporozoite samples. The dots represent the observed proportion of mutant pfcrt 76 alleles in each sporozoite sample against the observed proportion of mutant pfcrt 76 alleles in the paired gametocyte sample. The blue line represents the expected and theoretical distribution of dots if the vector has no influence in the transmission of pfcrt 76 alleles. The dot size is weighted by the number of samples.

