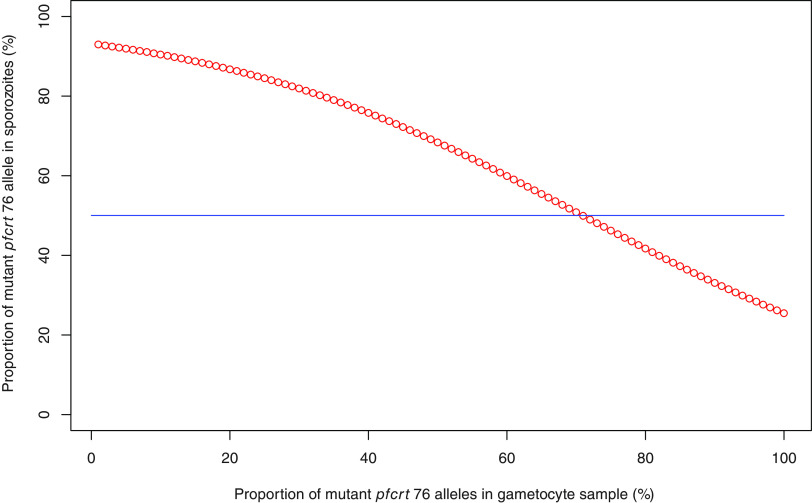
FIG 3.
Logistic regression of the probability of a higher proportion of mutant pfcrt 76 alleles in sporozoite samples as a function of the proportion of mutant pfcrt 76 alleles in gametocyte samples. The proportion of mutant pfcrt 76 alleles in sporozoite samples was compared to that in the paired gametocyte samples. The probability of having a higher proportion of mutant pfcrt 76 alleles in sporozoite samples was calculated for each gametocyte sample using a logistic regression; the donor effect was taken into account. This probability (expressed as a percentage) as a function of the proportion of mutant pfcrt 76 alleles in gametocyte samples was plotted (red line). The blue line represents the expected probability if the variation of the proportion of mutant pfcrt 76 alleles in sporozoite samples is randomly distributed (50% of a higher proportion and 50% of a lower proportion). By symmetry, the result was identical for the wild-type allele (see Fig. S3).

