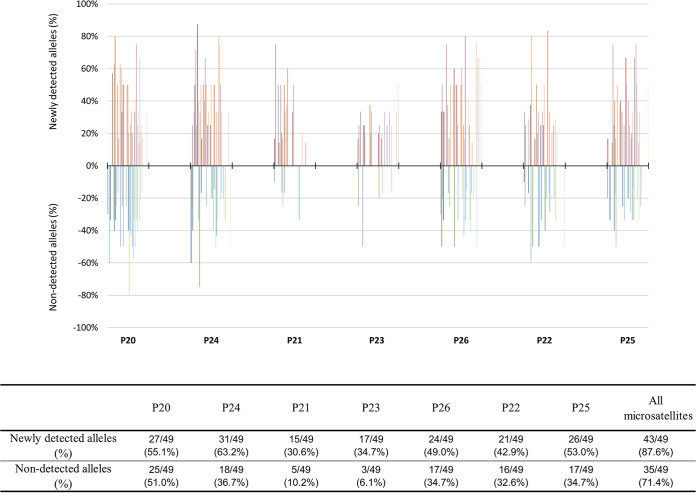
FIG 5.
Frequencies of newly detected alleles and nondetected alleles in paired sporozoites for each feeding as a function of microsatellites (x axis). The allelic composition in sporozoite samples was compared to that in their paired gametocyte samples. Each bar represents the newly detected (frequency of >0%) or the nondetected (frequency of <0%) alleles in sporozoite samples for each paired gametocyte sample. The table shows, for each microsatellite, the frequency of newly detected or nondetected alleles in all sporozoite samples compared to their frequency in the paired gametocyte samples.

