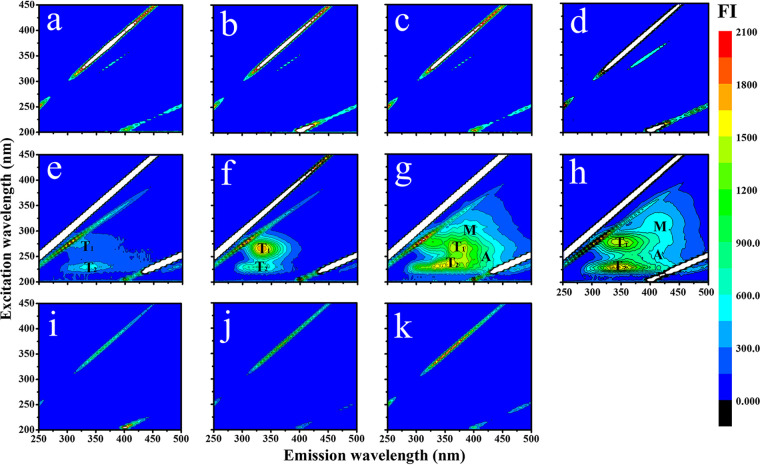
FIG 3.
Excitation-emission matrix spectroscopy of DOM fluorescence for S. dohrnii cultures in different growth phases (initial, exponential, stationary, and degradation). (a to d) S. dohrnii culture with antibiotics; (e to h) S. dohrnii without antibiotics; (i to k) bacteria only on day 0, day 6, and day 12, representing the early, exponential, and stationary phases, respectively. Fluorescence intensity (FI) is shown by color gradient. Peaks T1 and T2 were from tyrosine fluorescence. Peaks M and A represent microbial humic fluorescence and terrigenous humic acid fluorescence, respectively.

