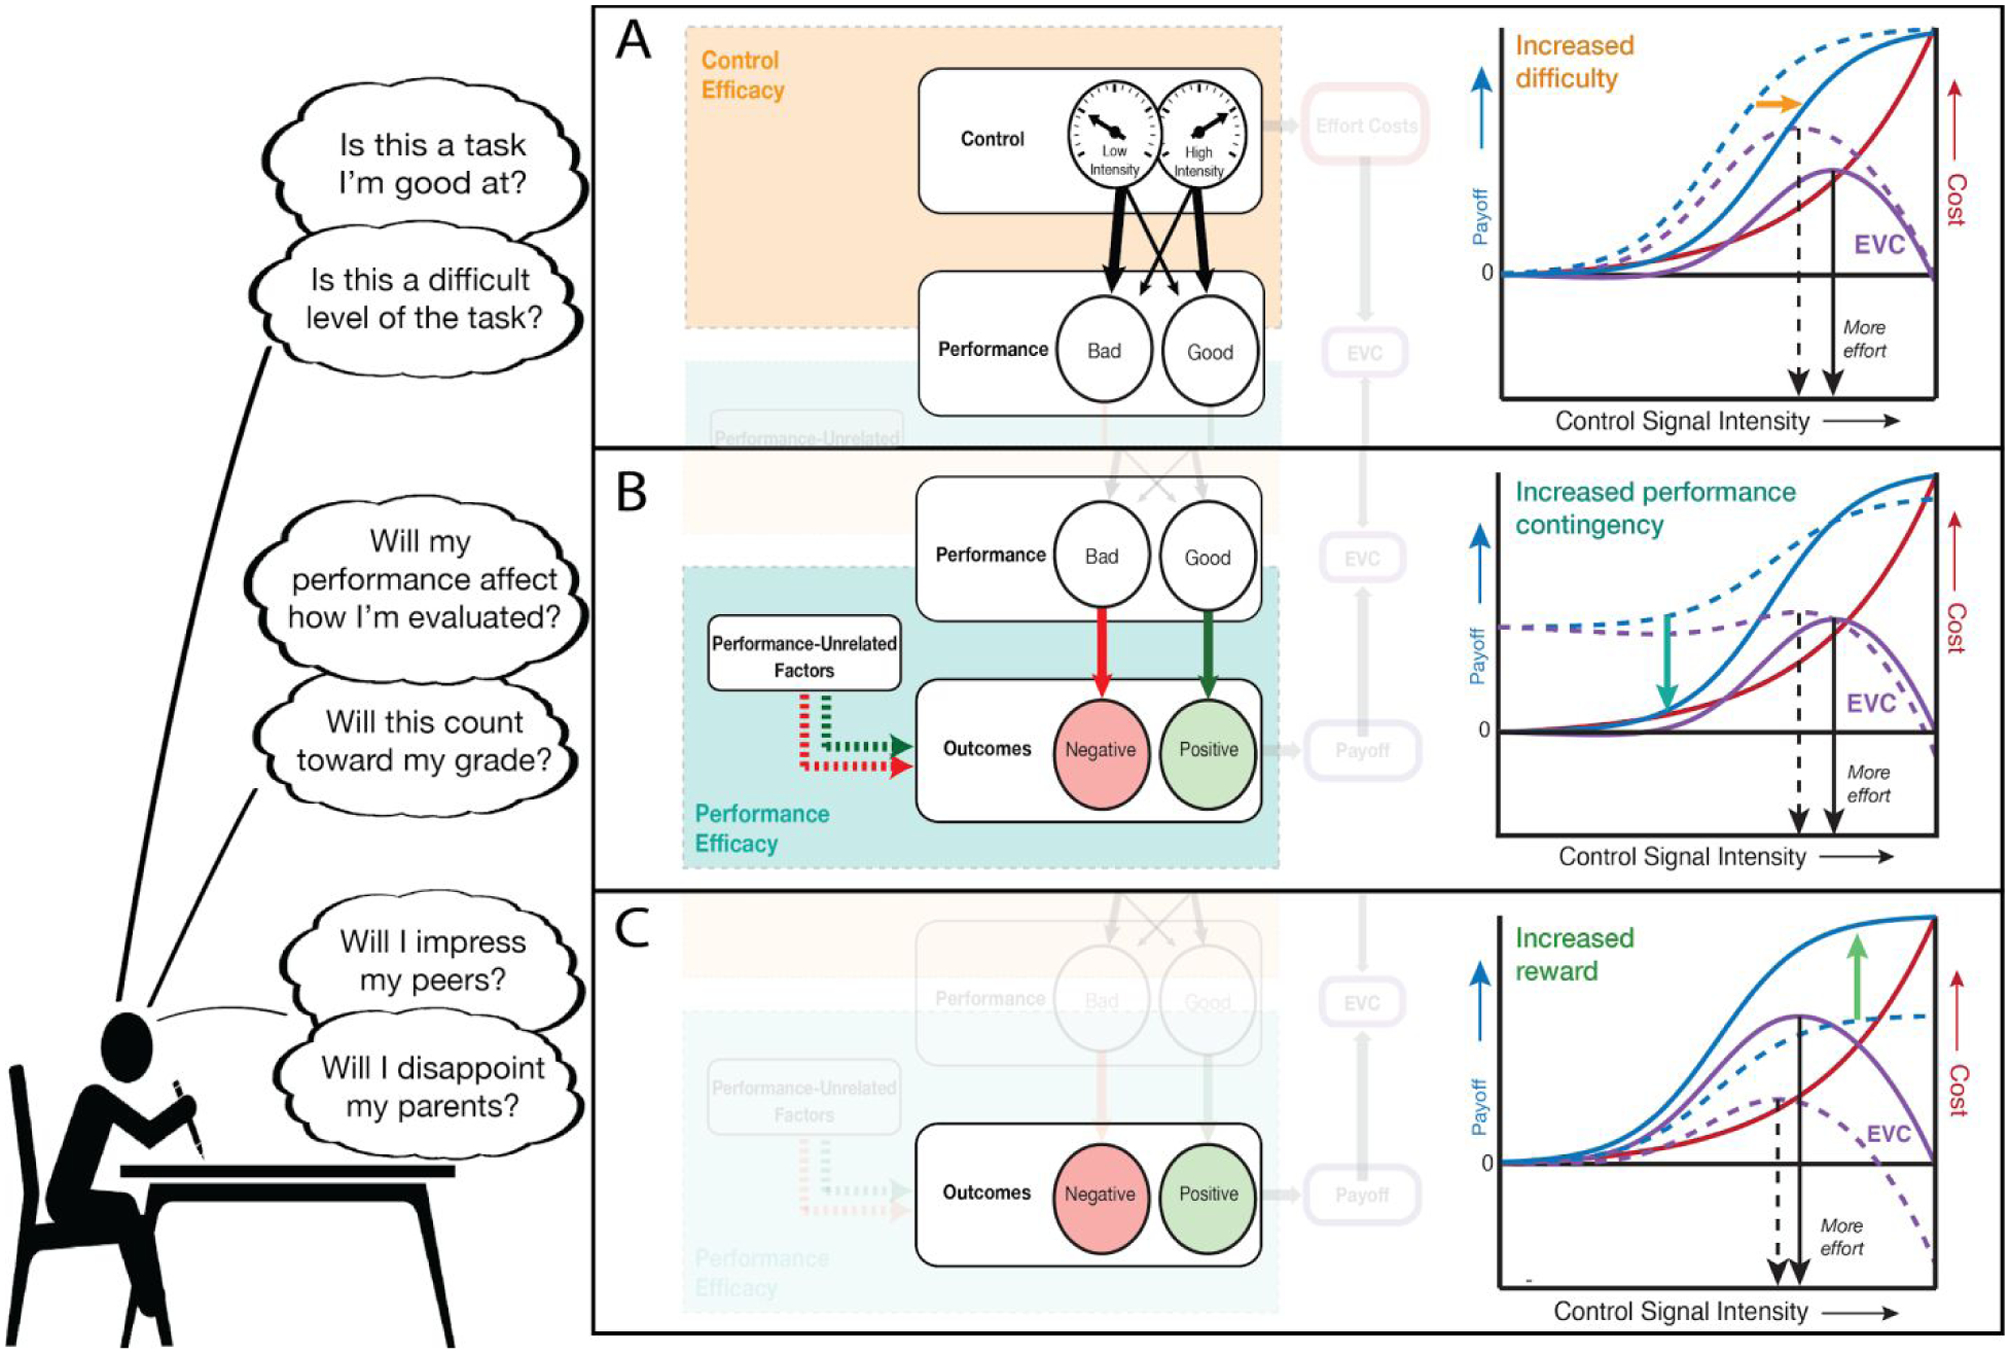
Figure 2.

According to the EVC model, a person’s effort allocation (e.g., how hard a student studies for an exam) is jointly determined by what they perceive as their expected outcomes, expected control efficacy, and expected performance efficacy. The student will generally be motivated to invest more effort the more they expect these efforts to achieve positive outcomes and/or avoid negative ones (C). However, the motivation to achieve these outcomes will change based on the extent to which the student sees those efforts as an effective means of achieving those outcomes. If the student sees themselves as having little ability to improve their performance by increasing cognitive control (low control efficacy; A), or if they perceive their performance as unlikely to be a major factor in determining those outcomes (low performance efficacy; B), they will be less motivated to invest effort into the task because the expected payoff for that effort has decreased. On the right side of each panel we visualize how changes in each of these components affects the evaluation and allocation of control. For each of these, the EVC for a given control intensity (purple curves) is calculated by subtracting the expected effort costs (red) from the expected payoffs (blue). The optimal level of control to invest is the one that maximizes EVC (vertical black arrows). In addition to being associated with higher effort costs, higher control intensities typically yield better performance, which typically yields better outcomes (i.e., higher payoffs). However, the shape of this payoff curve will vary based, for instance, on expectations of (A) task difficulty (affecting how much control is needed to achieve a given level of performance); (B) performance contingency (affecting how significantly payoffs increase with increased levels of performance); and (C) reward magnitude (affecting how high the peak of the payoff curves at the highest levels of performance). Right panels adapted from Shenhav et al. (2013) and Frömer et al. (2021).
