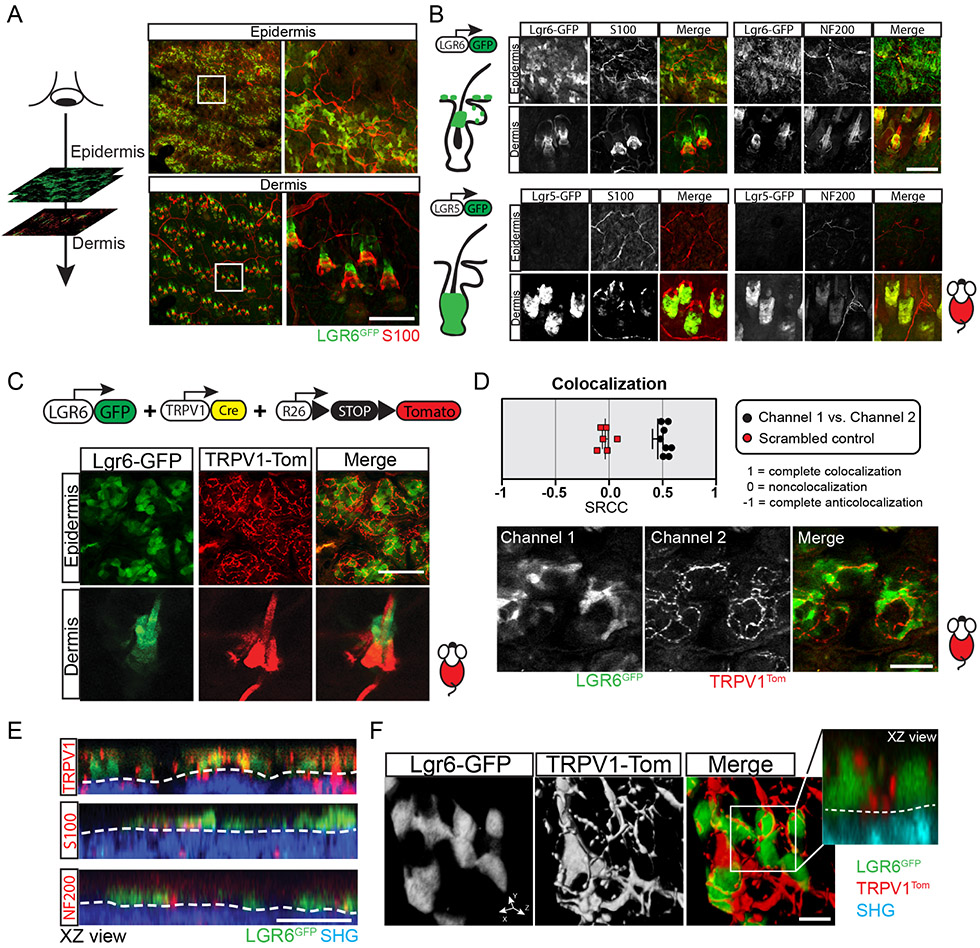
Figure 3. Colocalization of Lgr6 stem cells with sensory nerves in the epidermis.
(A) Schematic of serial optical sectioning, performed by two-photon microscopy, to provide a bird’s-eye view of the epidermis and dermis. Right panels show representative low and high magnification views of the corresponding skin compartments. (B) Examples of Lgr6GFP stem cells in the epidermis and hair follicles (dermis) and their locations are relative to the cutaneous nerves (top panels; see also Movie S1). Lgr5GFP stem cells are absent from the epidermis and do not co-localize with nerves within the hair follicles (bottom panels; see also Movie S2). (C) Genetic scheme to visualize interactions between nerves (TRPV1Tom) and Lgr6GFP stem cells by live imaging. Bottom panels show representative high magnification images of Lgr6GFP stem cells co-localizing with sensory nerves (TRPV1Tom) in the epidermis of live mice (see also Movie S3). (D) Colocalization analysis of Lgr6GFP stem cells and TRPV1Tom sensory nerve terminals within the epidermis. Spearman's rank correlation coefficient = 0.4552 (experimental), - 0.035 (control); n = 16 image samples from 3 mice. Bottom panel shows a representative example of the analyzed images. (E) Representative side views (XZ) of the mouse skin, reconstructed from serial optical sections showing the co-localization of Lgr6GFP stem cells with sensory nerves in the epidermis. Second harmonic generation (SHG), originating from the extracellular matrix, is used to demarcate the border between epidermis and dermis (white dashed line). (F) High-magnification 3D surface rendering demonstrate the physical proximity of epidermal Lgr6GFP stem cells with sensory nerves terminals (TRPV1Tom). Panel A (left column) shows tiled images of the mouse skin constructed from multiple fields-of-view. Scale bars: 100 μm (B-C), 50 μm (D-E), 10 μm (F)

