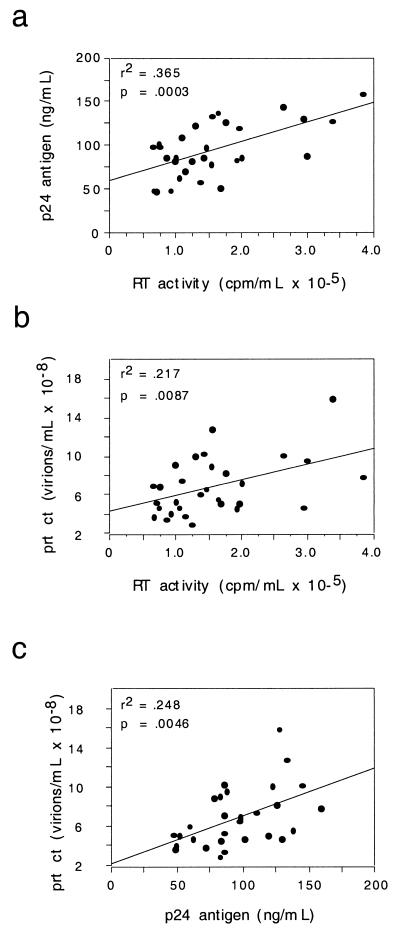
FIG. 2.
Regression plots of viral isolate physicochemical characteristics. Bivariate regression plots of supernatant p24 antigen concentration, reverse transcriptase (RT) activity, and viral particle count (prt ct) are shown for the panel of viral isolates. The square of the correlation coefficient (r2) and its associated P value are given for each plot.

