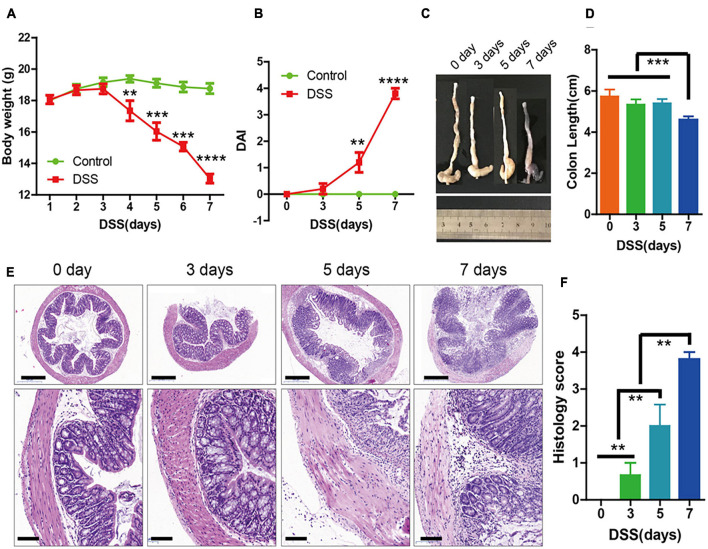
FIGURE 1.
The symptoms of dextran sulfate sodium (DSS)-induced colitis were significantly increased at 3 days. (A) Body weight in the control group and DSS-induced group (n = 10 per group) for 0 to 7 days. (B) Disease activity index (DAI) of each group (n = 10) for 0, 3, 5, and 7 days. (C,D) Colon lengths (n = 10). (E) Sections of colon tissues stained with hematoxylin and eosin (H&E) and (F) histology scores from the two groups. Data represent mean ± SD with three independent experiments. One-way ANOVA and Bonferroni tests for multiple testing were applied in all cases. **p < 0.01, ***p < 0.001, ****p < 0.0001. Scale bar = 500 and 100 μm.

