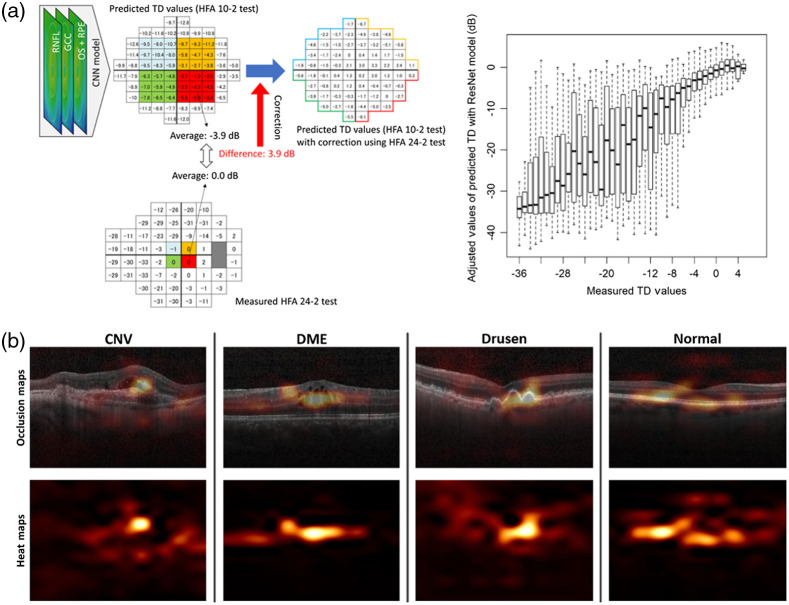
Fig. 11.
(a) A CNN model was used to predict TD values in the central 10 deg of the visual field (corresponding to HFA 10-2 test data). The mean TD values within the central 6 deg at each quadrant (36 and 4 test points for the HFA 10-2 and HFA 24-2 tests, respectively) were calculated. The corresponding test grids in the inferonasal quadrant are shown. The differences between these values were calculated, and the predicted TD values were adjusted as per the calculated differences in each sector. CNN, convolutional neural network; GCC, ganglion cell complex; HFA, Humphrey field analyzer; OS, outer segment; RNFL, retinal nerve fiber layer; RPE, retinal pigment epithelium; and TD, total deviation. The relationship between the actual TD values and the predicted TD values using the ResNet model adjusted with the measured TD values corresponding to the innermost four points of the HFA 24-2 test. HFA, Humphrey field analyzer and TD, total deviation. Adapted from Ref. 319. (b) Occlusion testing maps showing most significant regions for detecting retinal diseases. In these images, golden regions indicate a large impact on model predictions while orange and red regions indicate a very limited impact on predictions. The heat map was created after prediction by assigning the softmax probability of the correct label to each occluded area. The occlusion map was generated by superimposing the heat map on the input image. CNV, choroidal neovascularization and DME, diabetic macular edema. Adapted from Ref. 318.

