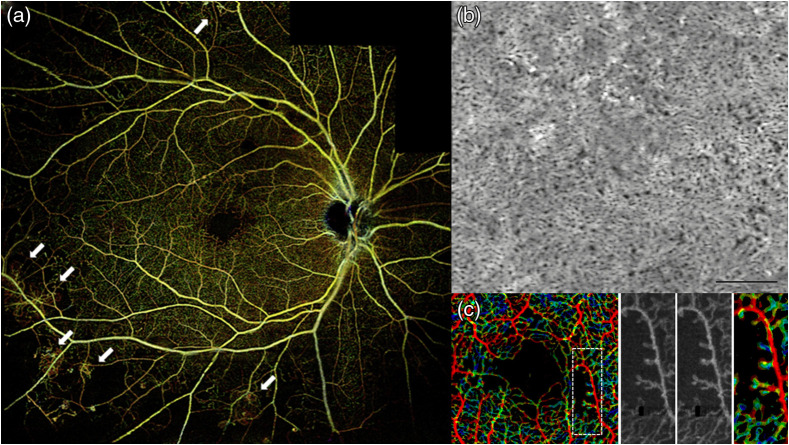
Fig. 6.
(a) Wide-field OCTA of the human retina: posterior pole montage of (about 40 deg) swept source OCTA. Adapted from Ref. 252. (b) Averaged OCTA image of the choriocapillaris. Adapted from Ref. 253. (c) OCTA VISTA image: red indicates faster blood flow speeds and blue indicates slower speeds. Enlargements to the right, with two different mean projection times of 1.5 and 3 ms as well as the OCTA VISTA version, respectively. Notice that the capillary loops, which likely correspond to microaneurysms, are associated with slower blood flow speeds. Adapted from Ref. 254.

