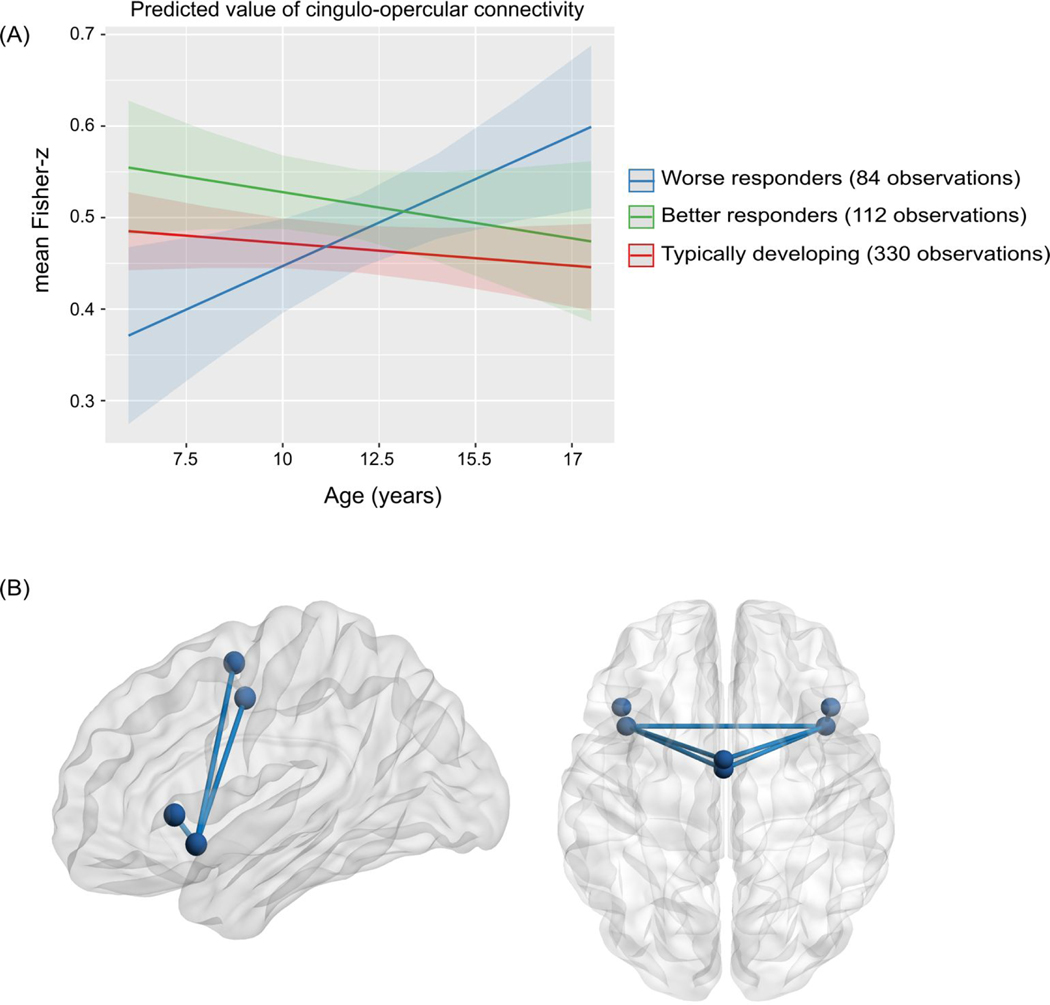
Figure 1. Shows the significant interaction between age and treatment response on cingulo-opercular connectivity.
(A). The graph shows the predicted estimates derived from the linear mixed-effects model for the effect of the interaction of age and treatment response group (worse responders, better responders and typically developing controls) on cingulo-opercular connectivity (F(2, 266)= 4.86, p=0.008). The y-axis represents the predicted mean of the Fisher-z transformed correlation coefficients for the cingulo-opercular network based on model estimates, and separate lines indicate group. Error-bars represent 95% confidence intervals. (B). Shows sagittal (left) and axial (right) views of the cingulo-opercular network. Spheres represent nodes (regions of interest) for each of the cingulo-opercular regions. Lines represent cingulo-opercular edges (connections between nodes) that were significant at a nominal p<0.05 uncorrected threshold in the follow-up edgewise analysis.

