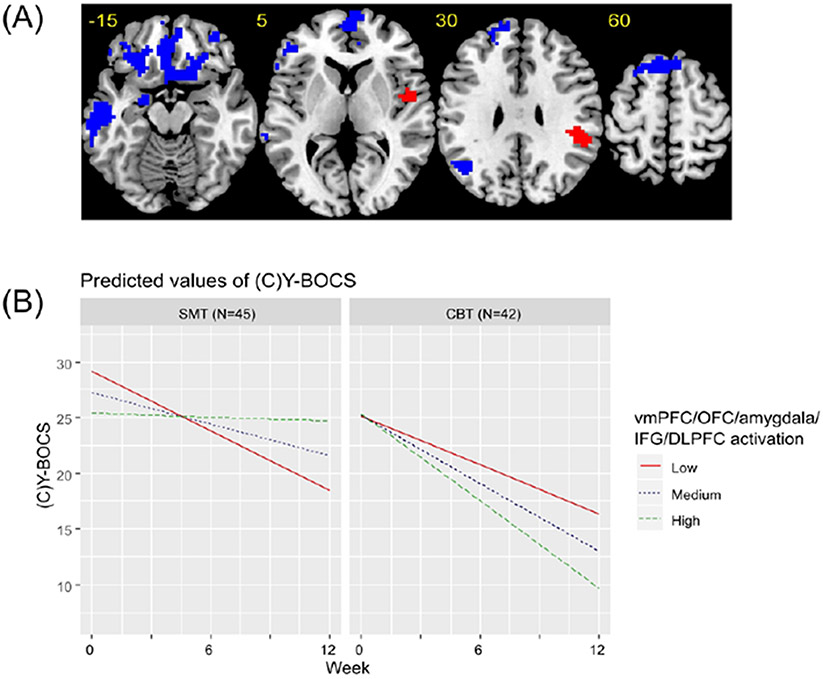
Figure 3. Brain regions significant in the linear mixed effects model for the reward processing contrast.
(A) Axial slices showing brain regions that were significant in the linear mixed-effects model of the interactive effect of voxel-activation during reward processing, treatment group and week on (Child’s) Yale-Brown Obsessive Compulsive Scale ((C)Y-BOCS) scores. All regions are presented at an uncorrected cluster forming threshold of p<0.001 and a familywise error corrected cluster threshold of p<0.05. Blue indicates regions where more pre-treatment activation was associated with greater symptom reduction over time in patients undergoing CBT, but a smaller reduction in symptoms over time in patients undergoing SMT. Red indicates regions where more pre-treatment activation was associated with a smaller reduction in symptoms over time in patients undergoing CBT, but a greater reduction in symptoms over time in patients undergoing SMT. (B) Graphs showing predicted model estimates for cognitive behavioral therapy (CBT) and stress management therapy (SMT) groups. The y-axis represents the predicted (C)Y-BOCS based on model estimates, and separate lines indicate level of vmPFC/OFC/amygdala/IFG/DLPFC activation (“Low” = one standard deviation below mean, “Medium” = mean, “High” = one standard deviation above the mean). Graphs for other regions are given in the Supplement.

