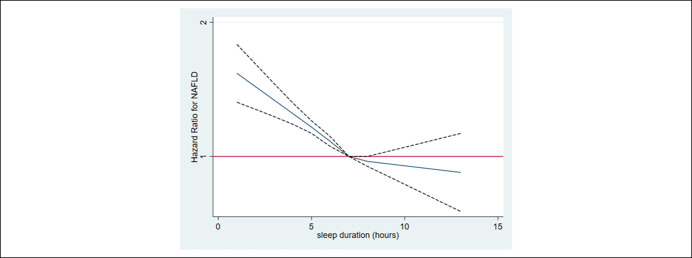
Figure 2.
Multivariable-adjusted HRs for NAFLD. The curves represent adjusted HRs for incident NAFLD based on restricted cubic splines with knots at the 5th, 27.5th, 50th, 72.5th, and 95th percentiles of sleep duration distribution. The model was adjusted for age, sex, center, year of the screening examination, body mass index, alcohol consumption, smoking, physical activity, total energy intake, marital status, season, education level, depression, history of diabetes, and history of hypertension. HR, hazard ratio.

