
Figure 4:
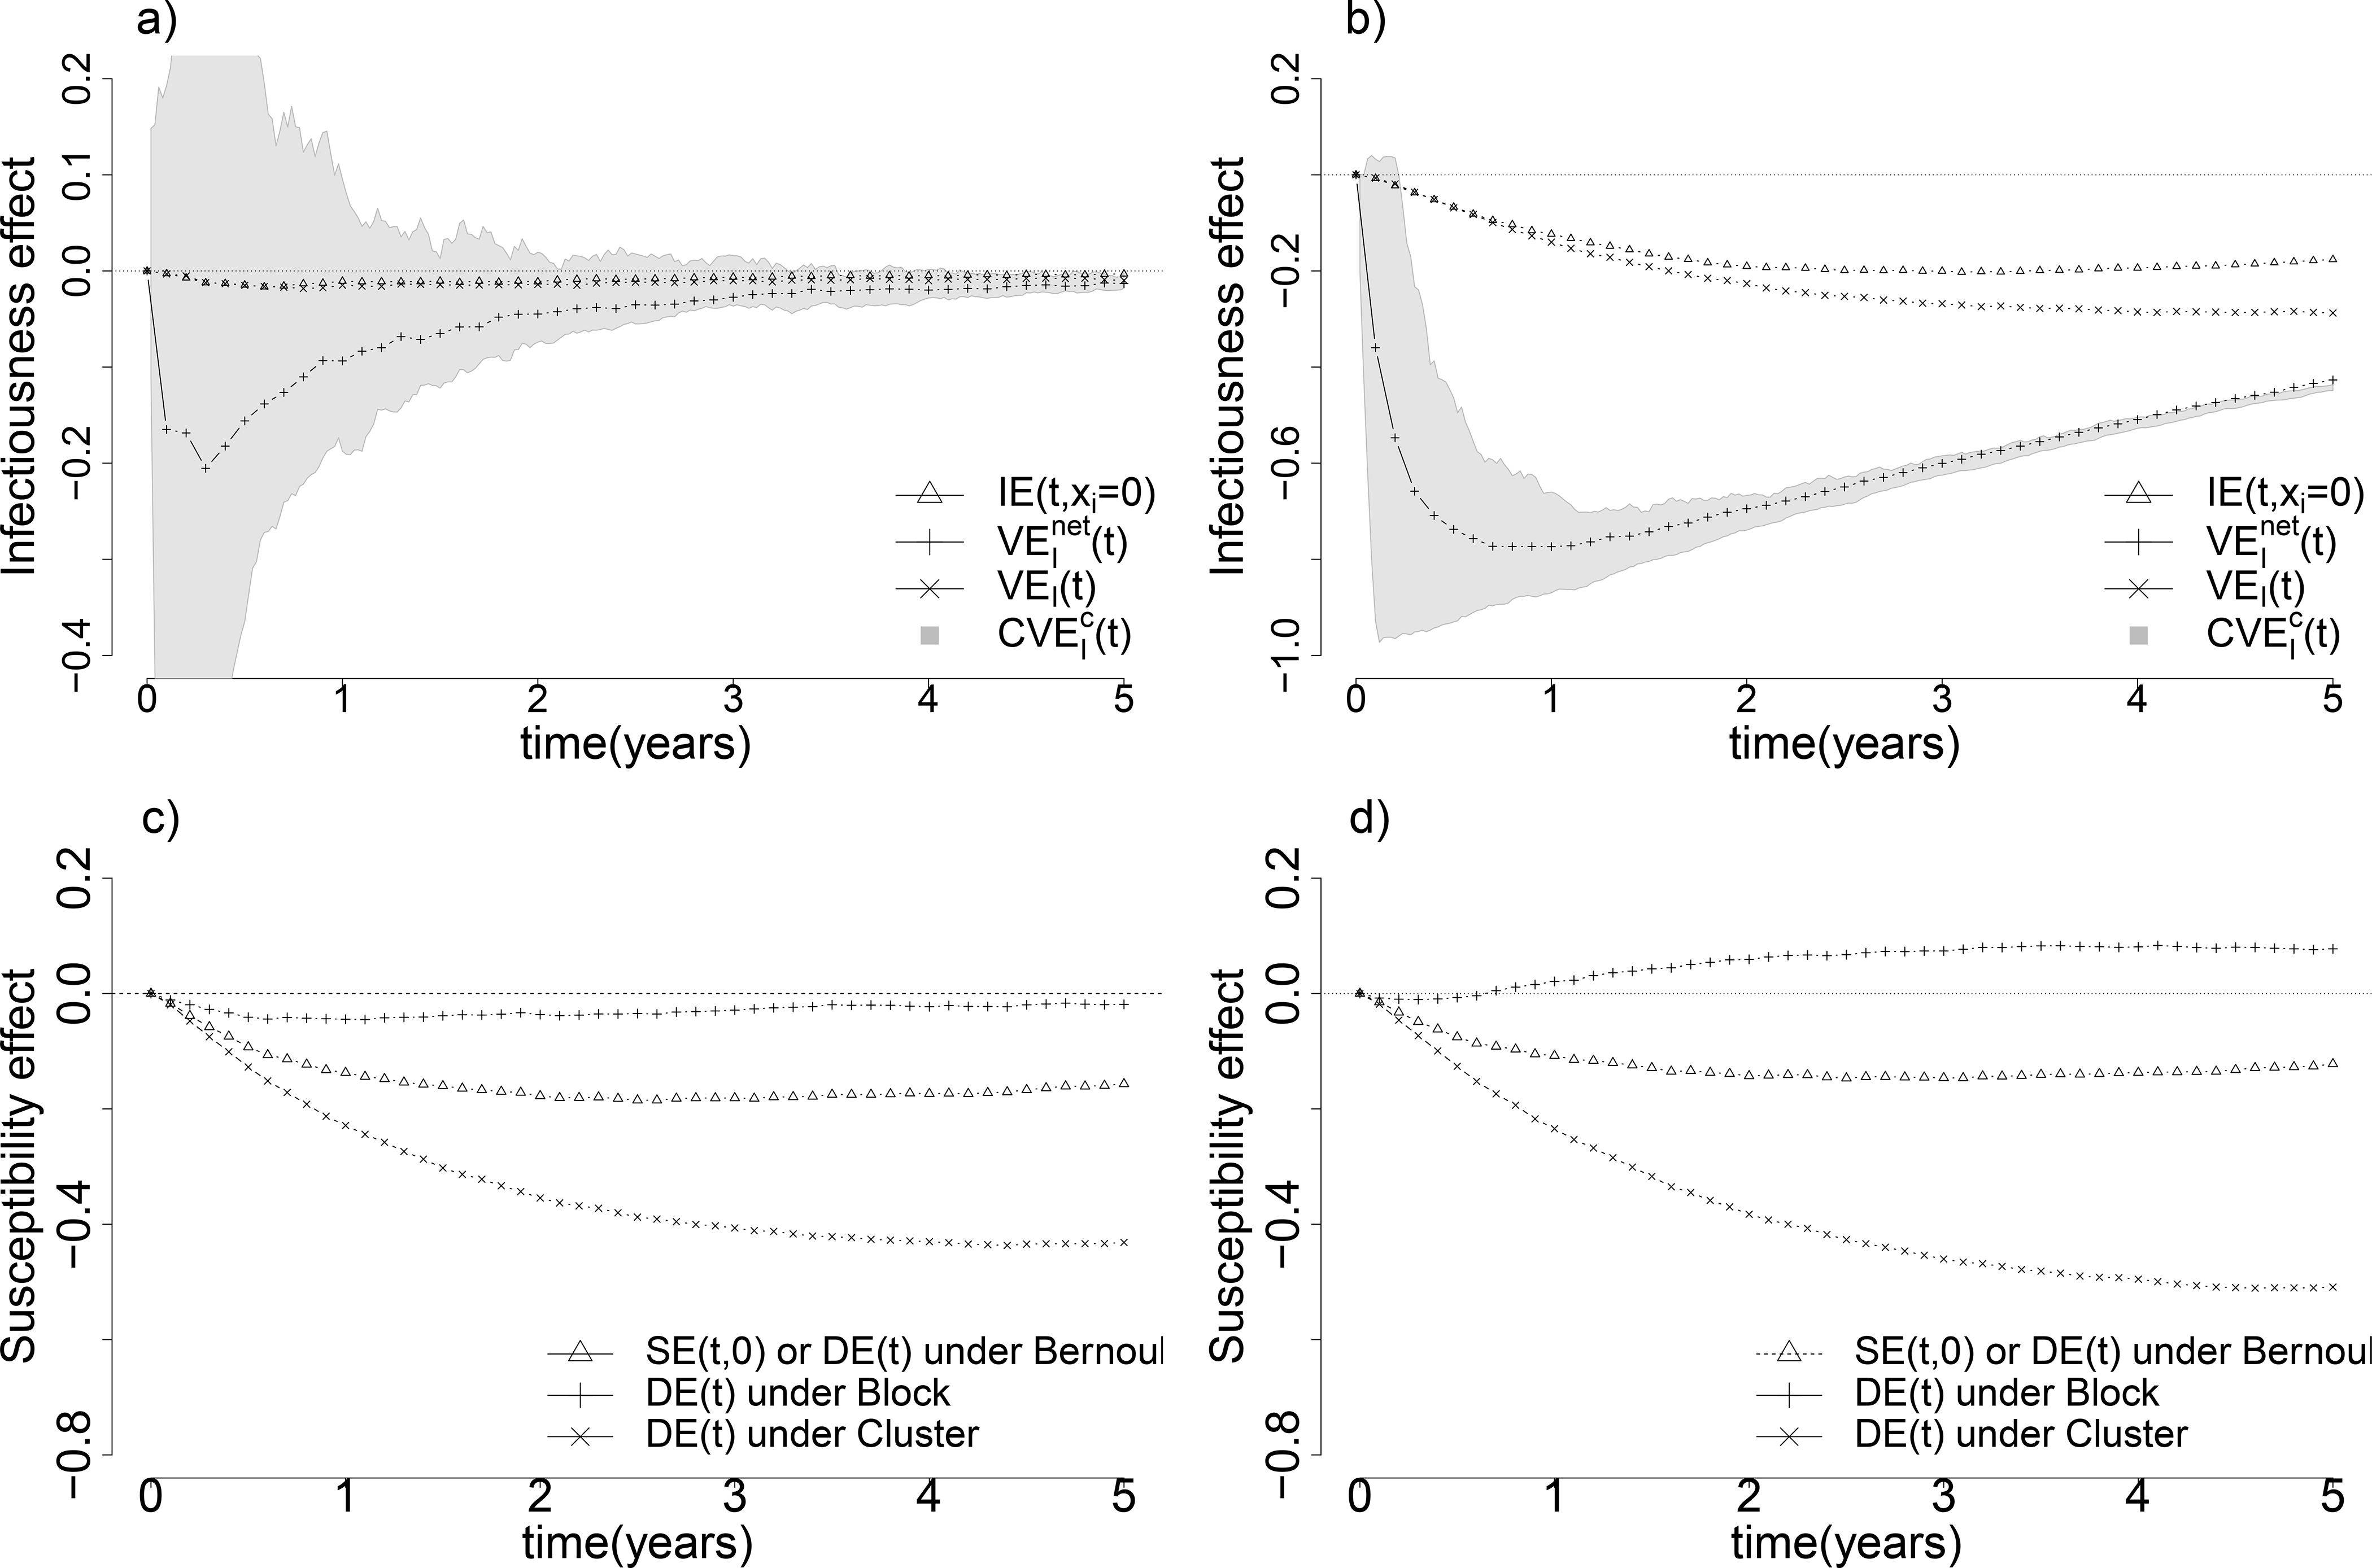
Comparison of different natural infectiousness and susceptibility effects. Figure a) compares different natural infectiousness effects – natural infectiousness effect IE(t, xi = 0), crude infectiousness effect , the infectiousness defined in mediation analysis VEI(t) and bounds identified by principal stratification – when both true susceptibility effect and true infectiousness effect are beneficial (eβ = 0.3, eσ = 0.5). Similarly, Figure b) shows the same comparison of multiple natural infectiousness effects as in Figure a) when the true infectiousness effect is much stronger than the true susceptibility effect (eβ = 0.4, eσ = 0.01). Figure c) shows the comparison of different types of natural susceptibility effect – the natural susceptibility effect SE(t, 0), the crude susceptibility effect DE(t) under Bernoulli, Complete, and Cluster randomization – when both true susceptibility effect and true infectiousness effect are beneficial (eβ = 0.3, eσ = 0.5) as in Figure a). Likewise, Figure d) shows the same comparison of multiple natural susceptibility effects when the true infectiousness effect is much stronger than the true susceptibility effect (eβ = 0.4, eσ = 0.01). All four graphs are under constant baseline hazards α(t) = 0.2 and γ(t) = 10.