
Figure 5:
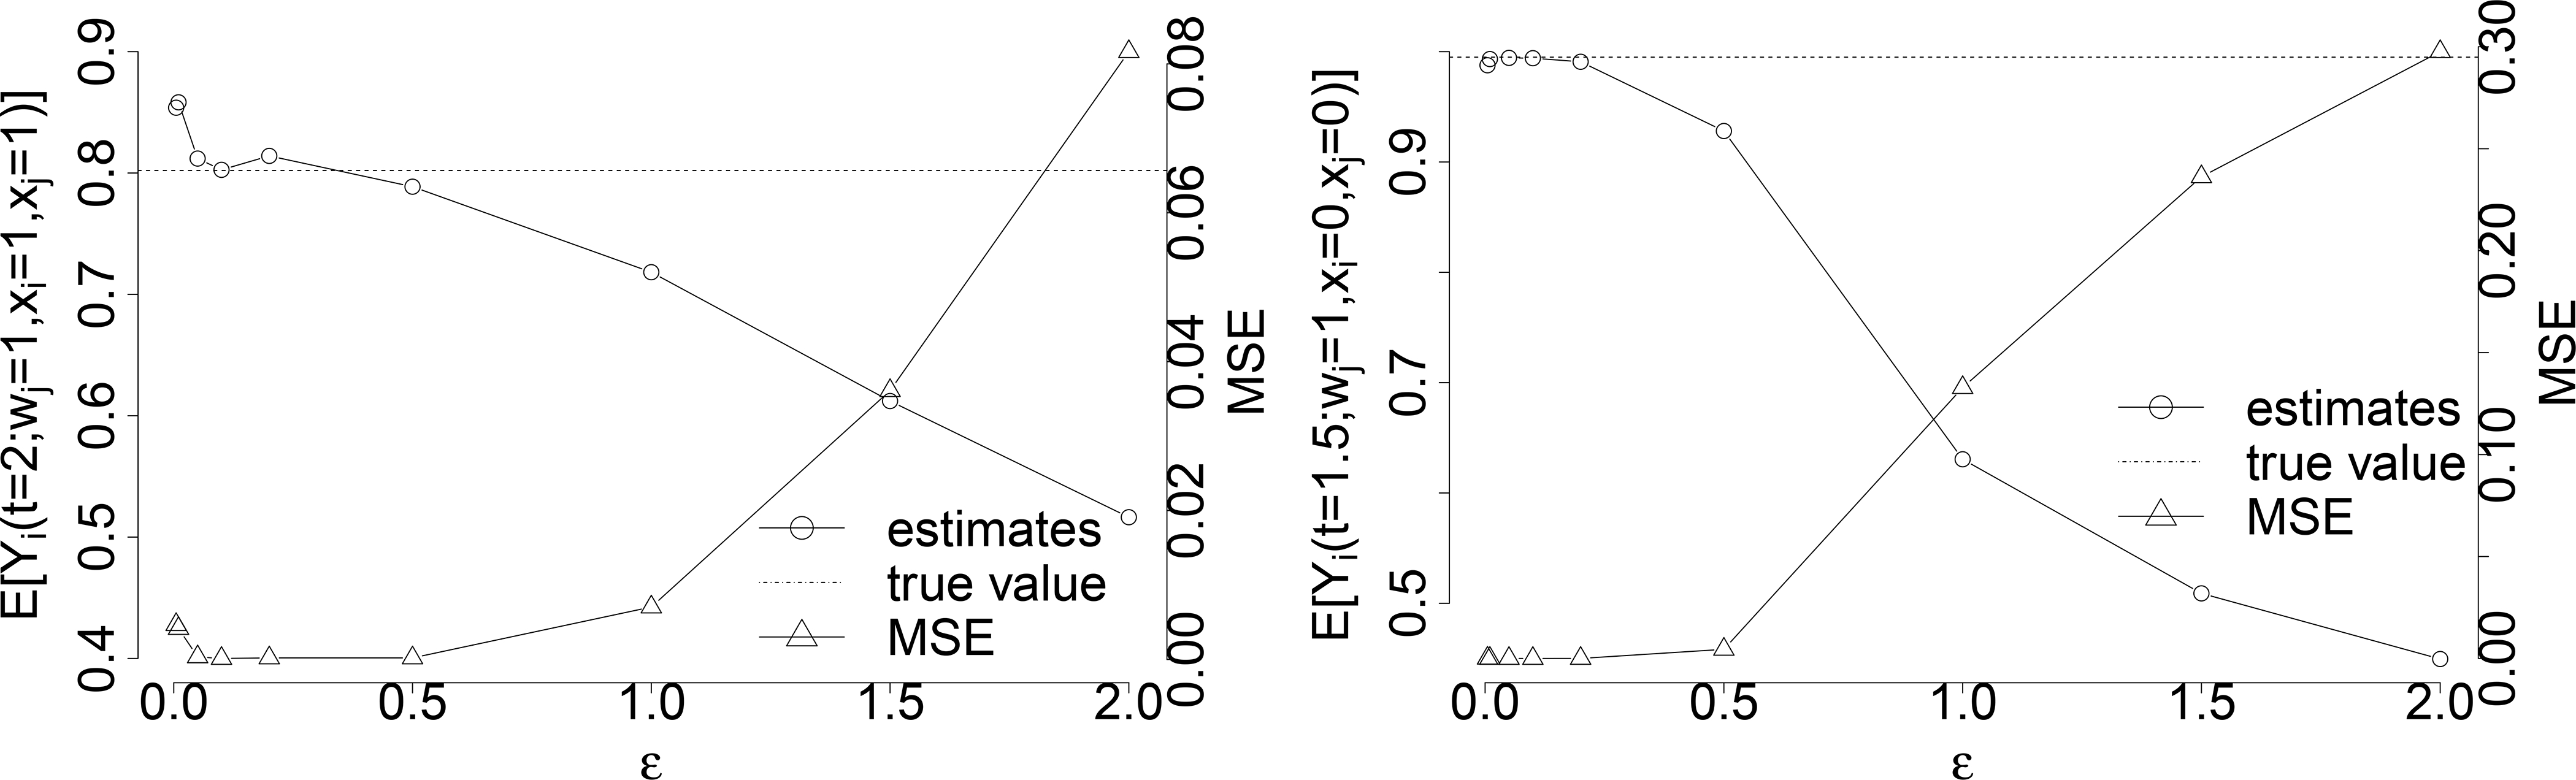
The choice of ε in the estimation of with sample size n = 100, 000 under the constant hazards α(t) = 0.2, γ(t) = 10 and coefficients and eσ = 0.5. Figure on the left shows the estimation of and its corresponding MSE under different choices of ϵ, and Figure on the right shows the estimation of and its corresponding MSE under difference choices of ϵ.