Figure 1.
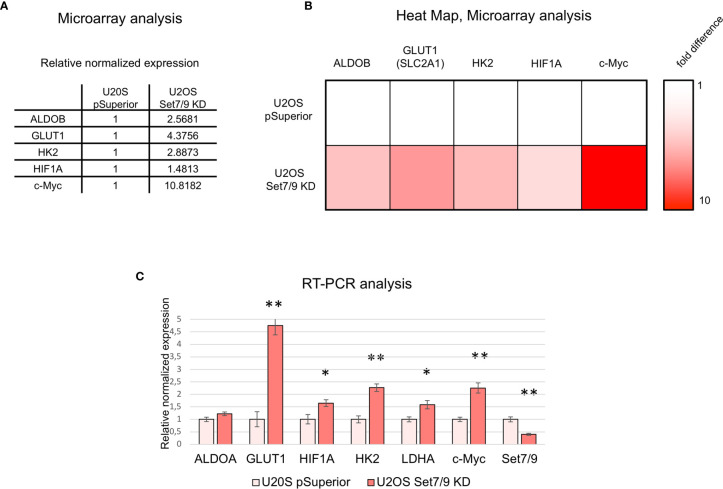
Microarray data analysis of U2OS Set7/9KD cells. (A) Relative expression of ALDOB, GLUT1, HK2, HIF1A, and c-Myc mRNAs in U2OS cells with tetracyclin-induced Set7/9 knockdown (tet-on system) compared to control U2OS pSuperior cells. Both cell lines were treated with doxycycline for 48 h prior to microarray analysis. (B) Heat map demonstrating ALDOB, GLUT1, HK2, HIF1A, and c-Myc mRNAs expression changes in Set7/9 KD U2OS cells compared to control U2OS pSuperior cells. (C) Validation of microarray data using quantitative RT-PCR: analysis of ALDOA, GLUT1, LDHA, HK2, HIF1A, c-Myc, and Set7/9 mRNAs expression in U2OS cells with tetracyclin-induced Set7/9 knock-down (Tet-on system) compared to control U2OS pSuperior cells. *p < 0.05; **p < 0.01.

