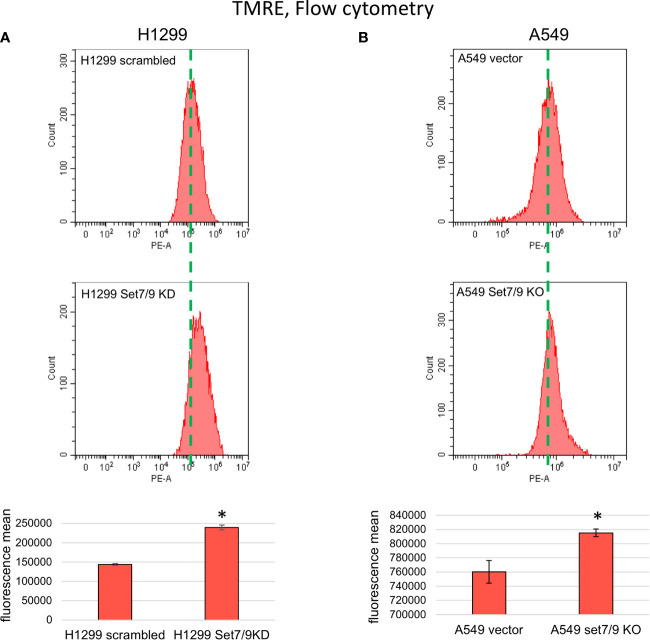
Figure 3.
The effect of Set7/9 decrease on mitochondrial membrane potential (MMP) of NSCLC cell lines H1299, A549 and H1975. FC analysis of TMRE staining of NSCLC cell lines (A) H1299 and (B) A549 with Set7/9 knockdown (Set7/9 KD) and knockout (Set7/9 KO) compared to control (scrambled or vector) cells. *p < 0.01.

