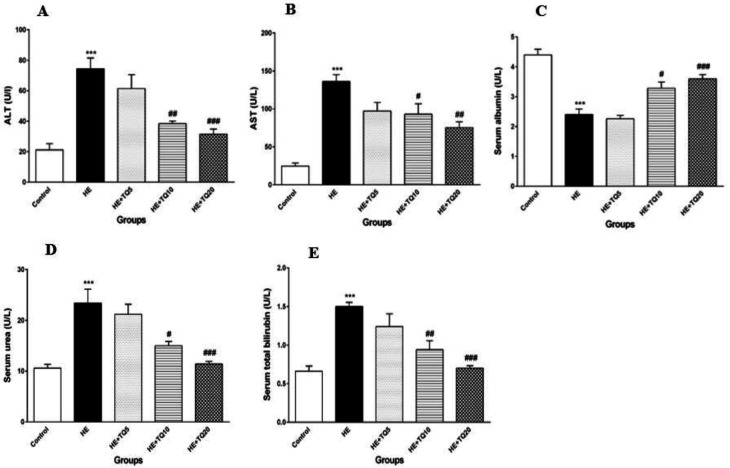
Figure 4.
Effects of TQ treatment on biochemical indexes in serum in different experimental groups. (A and B) serum ALT and AST levels, respectively; (C) serum albumin concentration; (D) serum urea levels; (E) serum total bilirubin concentration. Data are presented as mean ± SEM (n = 6). HE: Hepatic encephalopathy, TQ: Thymoquinone. ***P<0.001 vs control group, # P<0.05, ## P<0.01, and ### P<0.001 vs HE. Data were analyzed statistically by one-way ANOVA followed by Tukey's post-hoc test

