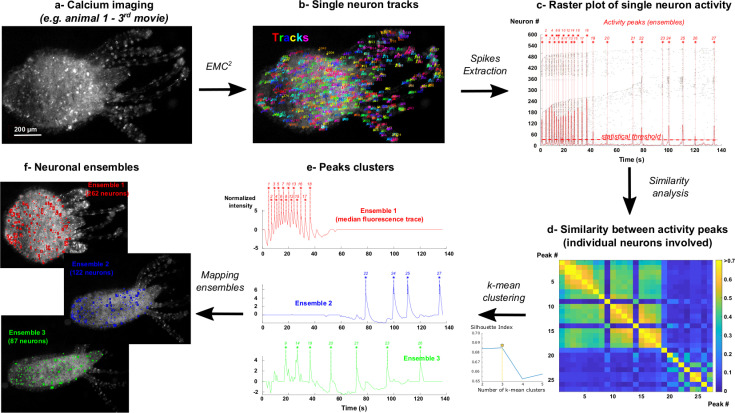
Fig 5. Neuron tracking and mapping of neuronal ensembles in behaving Hydra.
a- Calcium imaging of single neuron activity in behaving Hydra. The images and analysis of the 3rd movie of animal 1 are given as representative examples. b- Single neuron tracks and fluorescence intensity are obtained with EMC2 algorithm. c- For each neuron, spikes are extracted from fluorescence traces. Peaks of activity (highlighted with red stars) correspond to significant co-activity of individual neurons (sum of individual activities (solid red line) > statistical threshold (dashed red line), p = 0.001 see Materials and Methods). Each peak putatively corresponds to the activation of one neuronal ensemble. d- Similarity between activity peaks is computed using the identities of individual neurons that are firing at each peak (see Materials and Methods). e- The optimal number of peak classes (that putatively corresponds to the number of neuronal ensembles) is computed using the Silhouette index on k-means clustering of the similarity matrix (see Material and Methods). Median fluorescence trace of each neuronal ensemble and corresponding activity peaks are shown. The classification of individual neurons in each ensemble is determined based on their firing at ensemble peaks (see Materials and Methods). f- Individual neurons of each ensemble can be dynamically mapped in the original time-lapse sequence.

