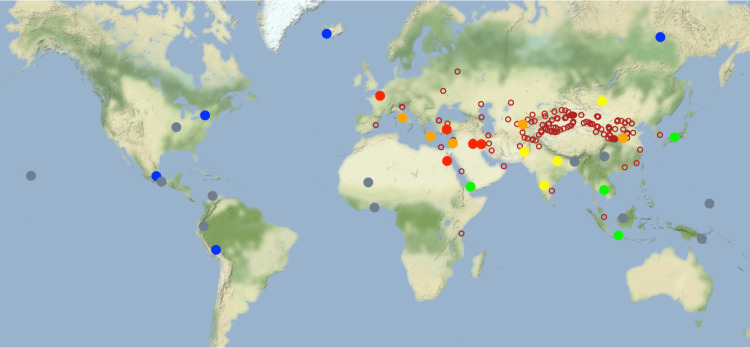
Fig 6. Results of similarity analysis.
NGAs are binned into 6 categories according to the earliest time they share 10 or more MilTech variables with another NGA, displayed by color: dark red = 2500 BCE or before; orange = between 2500 and 1500 BCE; yellow = between 1500 and 500 BCE; green = between 500 BCE and 500 CE; blue = after 500 CE; grey = did not display any similarities during our sample period. Unfilled red circles indicate Silk Route Nodes as in Fig 3.

