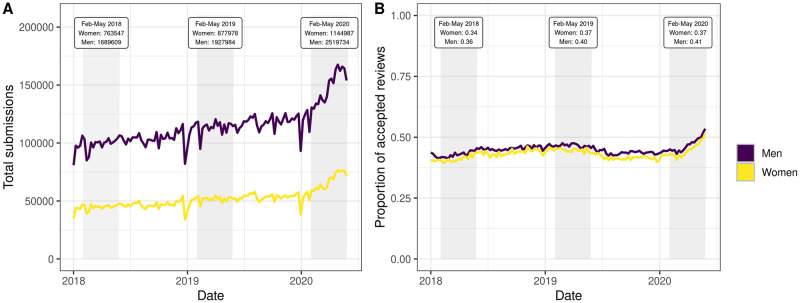
Fig 1. Total submissions (A) and proportion of accepted reviews (B) per week across the whole period covered by the dataset.
The shaded areas indicate the February-May period of each year considered in the analysis. Note that in panel A co-authored submissions were reported multiple times depending on the number of co-authors. Each author or referee whose gender was not successfully guessed by our algorithm was excluded.

