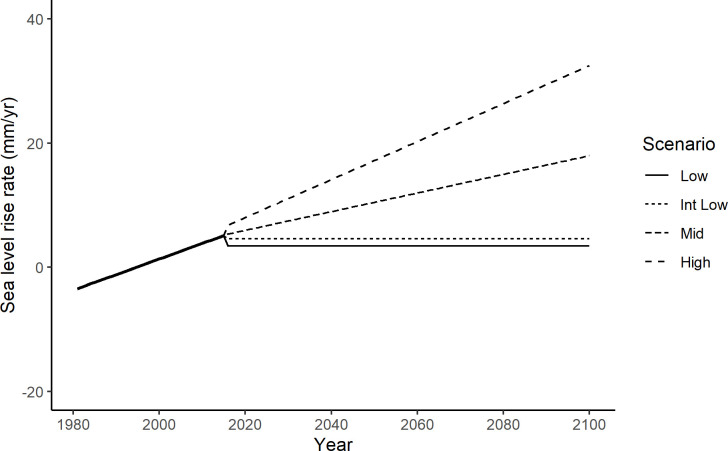
Fig 3. Sea-level rise scenarios.
Recent historic and projected rates of sea-level rise for San Francisco Bay. The observed change in annual mean sea level (mm yr-1) from 1981–2015 at the Golden Gate gage, relative to 2000 (bold line) and projected rates of sea-level rise from four scenarios [15].

