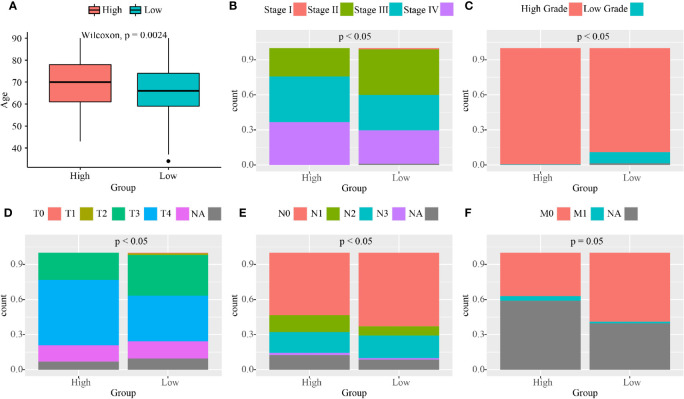
Figure 6.
The analyses of clinical features between the high and low nuclear MTRGs score groups from the TCGA cohort. (A) Boxplots exhibit the age at diagnosis for the high and low nuclear MTRGs score groups (p=0.0024). Percentage-staked bar plots show the distribution of BC patients with the different clinical stage (B), histological grade (C), tumor stage (D), lymph node status (E), and tumor metastasis (F) between the high and low nuclear MTRGs score groups (p<0.05 was considered as significant; NA, not applicable).

