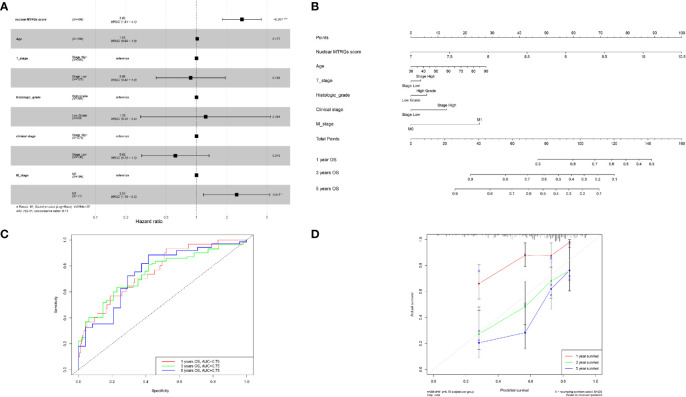
Figure 9.
Construction and evaluation of a nomogram. (A) The multivariate Cox regression analysis for the nuclear MTRGs signature and clinical indexes. (B) The constructed nomogram to predict the OS possibilities of BC patients. (C) The ROC curves of the nomogram for OS at 1, 3, and 5 years. (D) Calibration blots indicated the agreement between the predicted OS and actual OS at 1, 3, and 5 years. *p < 0.05, ***p < 0.001.

