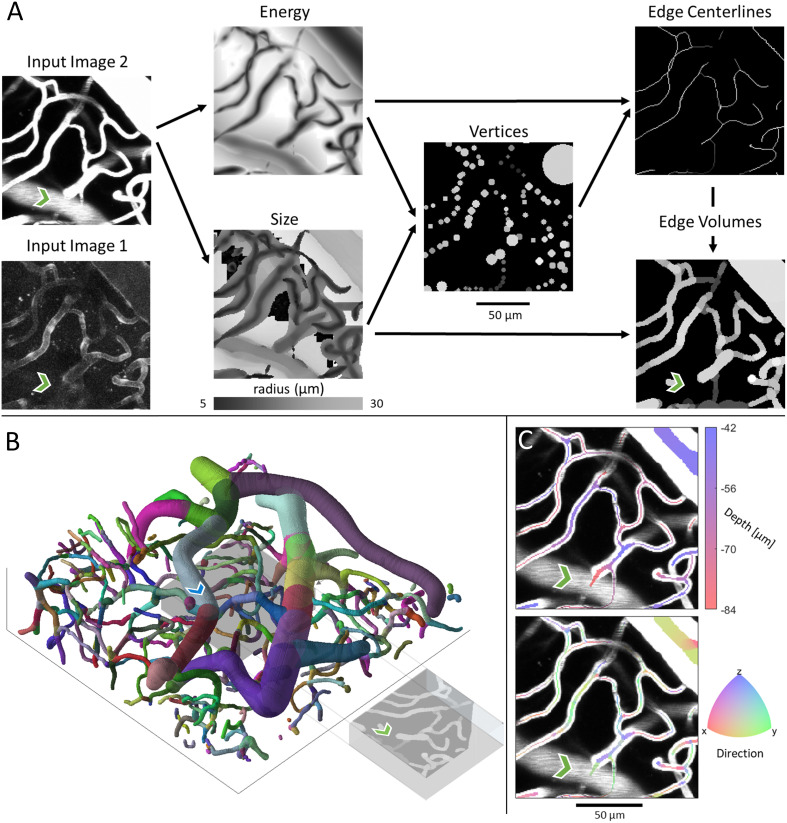
Fig 2. Example projections of original two-photon images, intermediate outputs, and vector renderings of manually assisted SLAVV applied to Image 2.
The green chevron is directly underneath a medium sized vessel which bleeds into the original projection volume for the plasma-labeled Image 2 but not the endothelial-labeled Image 1. A. Either Image 1 or 2 could be the input (Image 2 outputs shown here, Image 1 outputs are similar (S1 Fig). The original image is subject to multiscale, LoG, matched filtering to obtain three-dimensional energy and size images. The energy image is used to estimate vertex centers and the size image to estimate their radii. Vertices are used as genesis and terminus points for energy image exploration in the centerline extraction algorithm. Finally, estimated vessel radii are recalled from the size image to form the volume-filled vector rendering. Gray-scale coloring in the vector renderings corresponds to the energy values and thus vector probabilities. B. Three-dimensional visual output of SLAVV. Colors represent strands, which are defined as non-bifurcating vessel segments. Each strand is assigned a random color. The image is 125 μm in z and 460 in x and y. The projection volume used in the other panels is shown as a gray box in the center of the larger volume. The blue chevron marks the vessel that bleeds into Image 2 at the green chevron. C. Depth and direction outputs from SLAVV. Vector volumes are rendered over the original projection at a quarter of their original radius to facilitate the visualization of the underlying vessels. Direction is calculated by spatial difference quotient with respect to edge trajectory. The centerline for the vessel above the green chevron lies above the projection volume.

