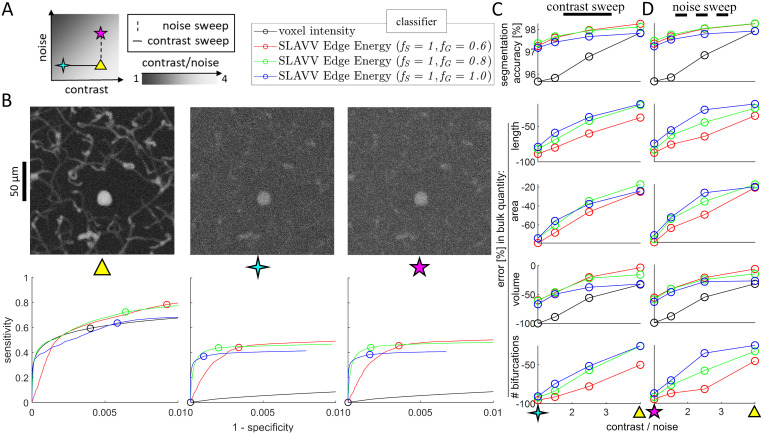
Fig 4. Objective performance of fully-automated SLAVV software.
A. Simulated images of varying quality are generated from the vector set from Image 3 shown in Fig 3. Image quality is swept along contrast and noise axes, independently. Example maximum intensity projections are shown for three extremes of image quality (triangle: best quality, 4-point star: high noise, 5-point star: lowest contrast). The legend shows the labels for the four segmentation methods used in B-D. Images are vectorized using SLAVV with different amounts of Gaussian filter, fG (60, 80, or 100% of matched filter length). B. Vasculature is segmented from three simulated images using four automated approaches: thresholding either voxel intensity or maximum energy feature on edge objects produced by three automated vectorizations. Voxel-by-voxel classification strengths of thresholded vectorized objects or voxel intensities are shown as ROC curves for three of the seven input images. Note that the ROC curves for the energy feature of vectors do not have support for every voxel, because not every voxel is contained in an extracted vector volume. Operating points with maximal classification accuracy are indicated by circles in the bottom row of B and plotted in the top row of C&D across all input images. C&D. Bulk network statistics (length, area, volume, and number of bifurcations) were extracted from vectors or binary images resulting from maximal accuracy operating points. Performance metrics were plotted against CNR (image quality) for a (C) contrast or (D) noise sweep. Thresholding vectorized objects to segment vasculature demonstrated a greater robustness to image quality than thresholding voxel intensities. Surface area, length, and number of bifurcations were not extracted from binary images, because these images were topologically very inaccurate.

